6. Changing Population
6. Changing Populations
-
6.1.1 Patterns and trends in global population growth.
6.1.2 Reasons for the growth and decline of a country’s population: fertility rate, birth rate, death rate, natural increase, migration.
6.1.3 An evaluation of the impacts of pro-natalist and anti-natalist policies on birth rates.
6.1.4 The demographic transition model (DTM) and its strengths and limitations.
-
6.2.1 Factors influencing population structures: natural increase and net migration.
6.2.2 The causes and impacts of youthful and ageing population structures, and an evaluation of their impacts.
6.2.3 One detailed specific example of a named country to include:
• reasons for population growth or decline
• the impacts of a population policy (pro or anti-natalist). -
6.3.1 Types of migrant: economic migrant, asylum seeker and refugee.
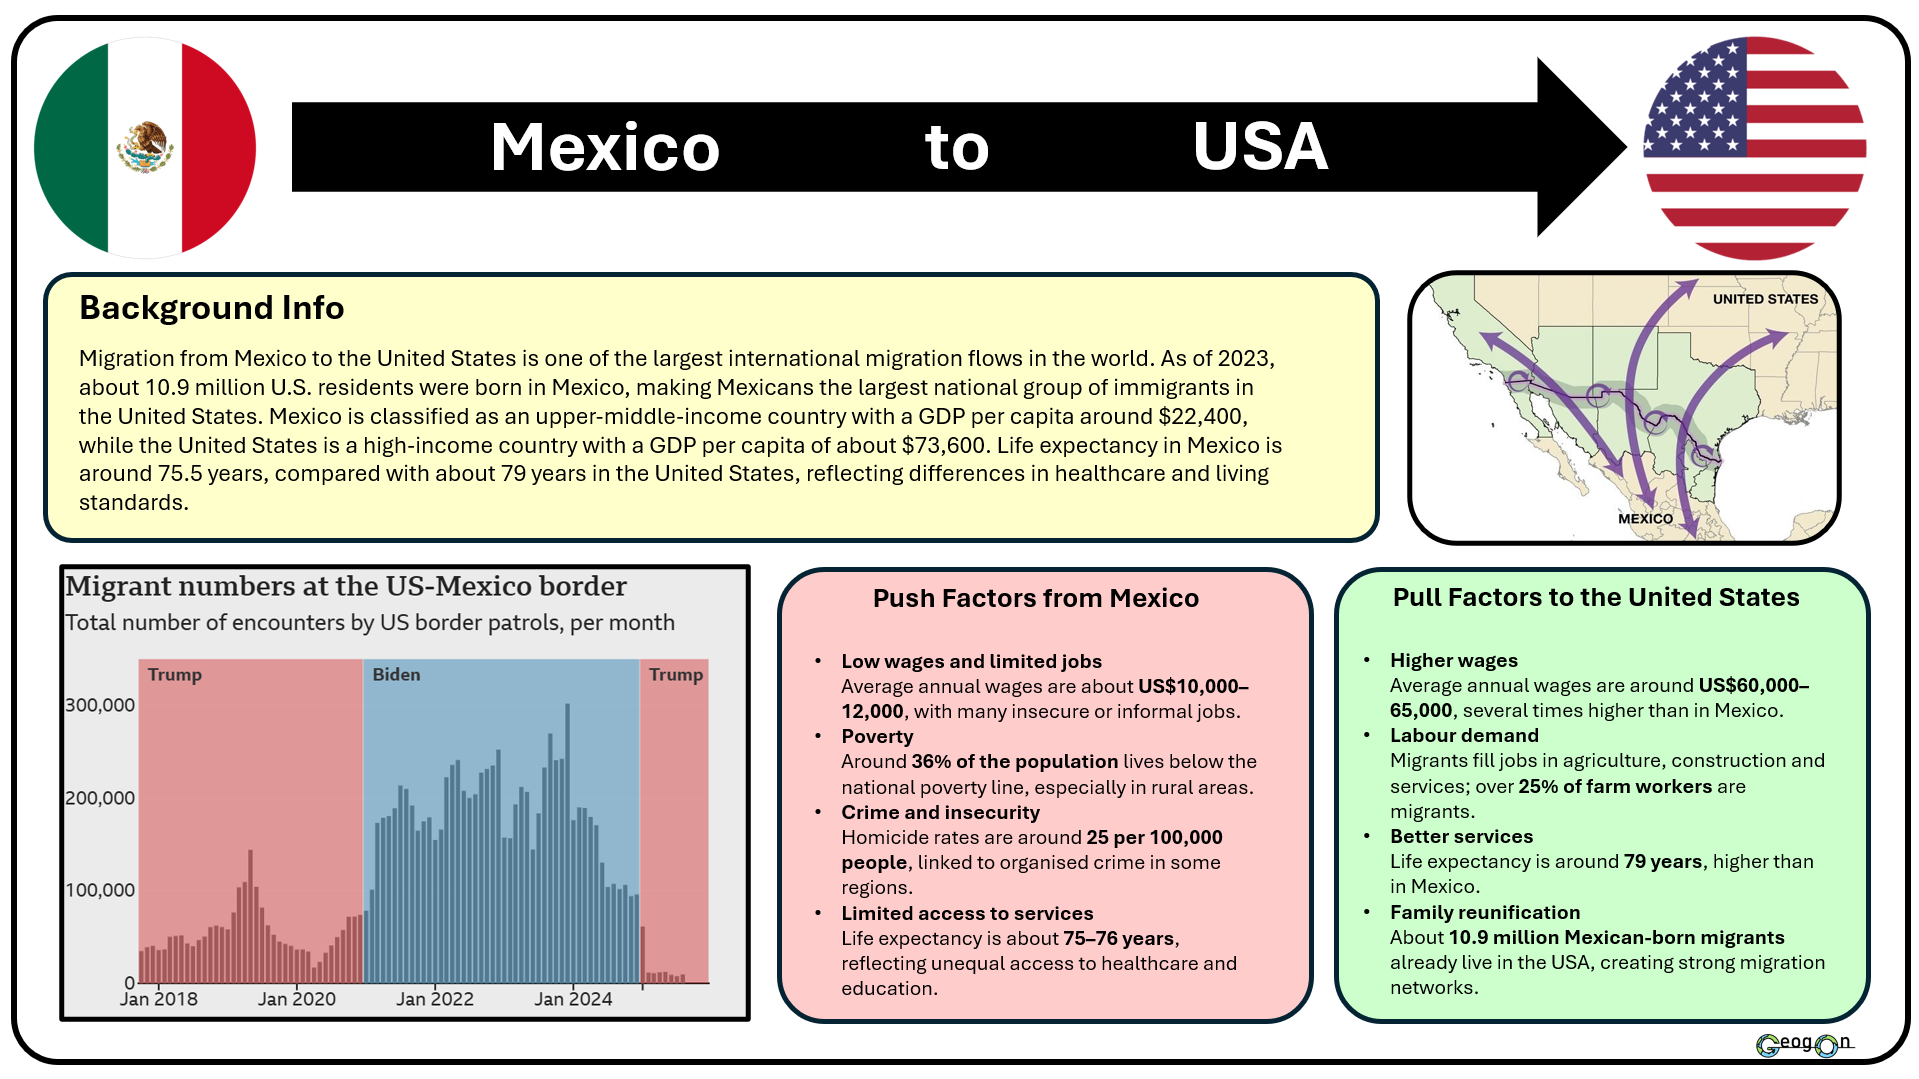
6.3.2 Causes of migration, to include push and pull factors.
6.3.3 The impacts of migration on the migrant, their country of origin and the destination country.
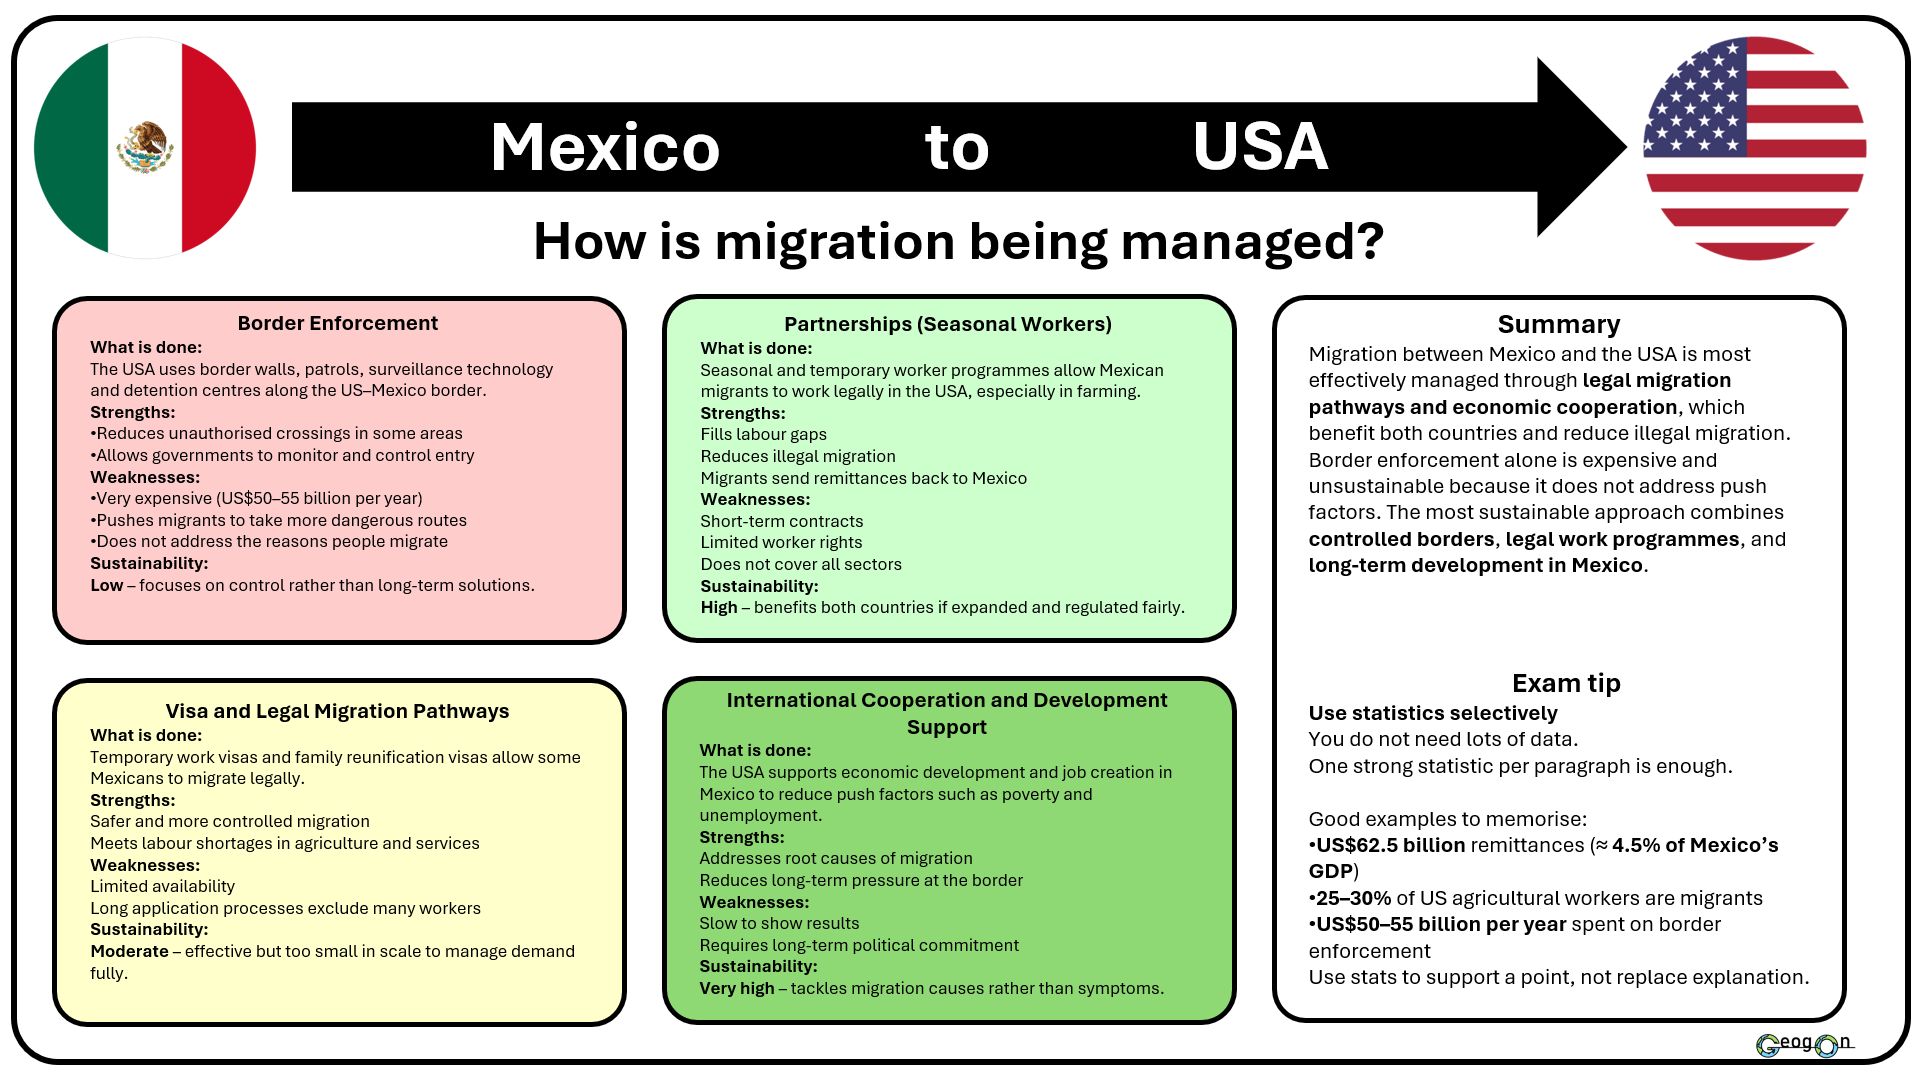
6.3.4 An evaluation of the strategies and techniques used to manage international migration.
6.3.5 One detailed specific example to include:
• push and pull factors of a named international migration (named to include the country of origin and destination country)
• the impacts of the migration (on the migrants, their country of origin and the destination country)
• how the migration is managed; including sustainable.
6.1 Introduction to Population
Population change means how the number of people living in a place increases or decreases over time.
This depends on births, deaths, immigration (people arriving) and emigration (people leaving).
To help you understand this, imagine that the population is like water in a bathtub.
Birth rate is like how fast the taps are running — it measures how many babies are born each year for every 1 000 people.
Death rate is like how wide the plughole is open — it measures how many people die each year for every 1 000 people.
Natural increase happens when the taps flow faster than the plughole drains (birth rate > death rate).
Natural decrease happens when the plughole drains faster than the taps flow (death rate > birth rate).
Immigration adds extra water from the shower, and emigration lets water spill out — these also change the total level.

6.1.1 Patterns and trends in global population growth.
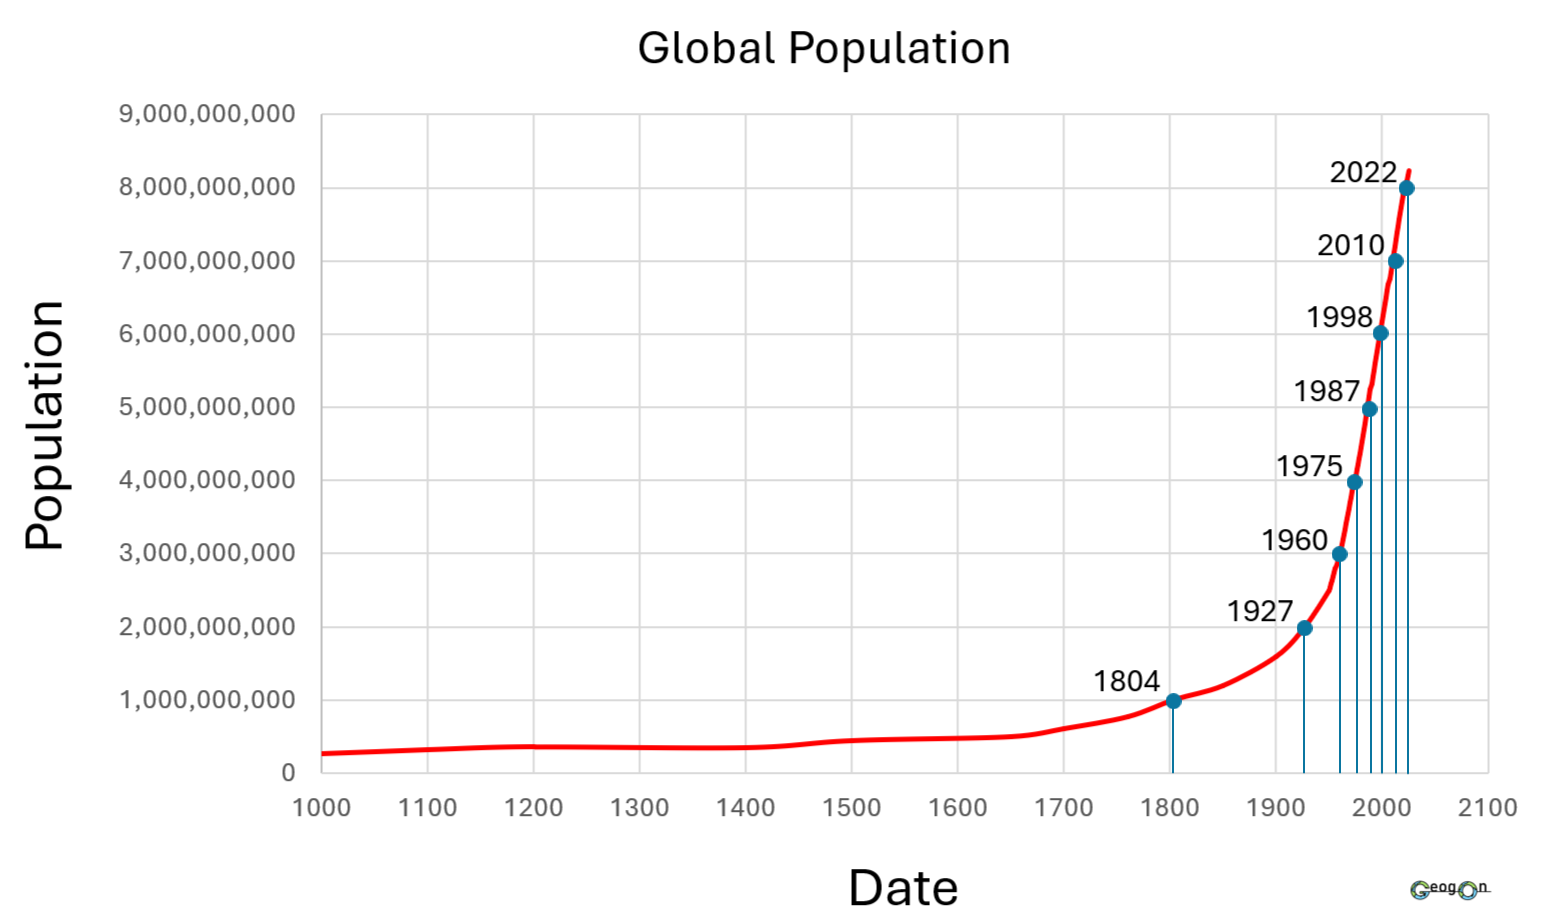
The world’s population has changed dramatically over time. For most of history, the number of people grew slowly — but in the last few hundred years, it has grown very quickly.
Before 1800: Low and steady
High death rates and low life expectancy meant population grew slowly. Many people died from disease and poor food supplies.
1800–1950: Gradual increase
Industrial Revolution improved farming, medicine, and transport. Birth rates stayed high while death rates began to fall.
1950–today: Rapid growth (exponential increase)
Big fall in death rates, especially in LICs. Better healthcare, food and sanitation meant people lived longer.
Today (2020s): Slower growth
Birth rates are now falling in many countries as education and living standards rise. Population is still growing, but more slowly.
Population Trends by Continent
800–1900: Slow Growth
In 1800, only about 1 billion people lived on Earth.
Most people lived in Asia and Europe.
Birth rates were high, but many people died young from disease or hunger.
Population in Africa and South America grew slowly because of poor healthcare.
All countries were small and poor (LICs). Growth was very slow.
1900–1950: Growth Starts to Increase
In Europe and North America, factories, clean water, and better medicine reduced deaths.
Birth rates stayed high, so population began to grow.
In Asia and South America, growth also started to rise slowly.
HICs grew first. LICs and MICs started to catch up later.
1950–2000: Population Explosion
After 1950, the world’s population grew very fast — from 2.5 to 6 billion.
LICs and MICs in Asia, Africa, and South America grew quickly because death rates fell but birth rates stayed high.
HICs in Europe and North America slowed down — smaller families, more education, and ageing populations.
Most population growth happened in developing countries (LICs and MICs).
2000–2025: Slower Growth, Uneven Spread
The world passed 8 billion people in 2023.
Africa is growing fastest — countries like Nigeria and Ethiopia have many young people.
Asia is growing more slowly — China and Japan are even shrinking.
Europe is ageing and has very low birth rates.
Most new population growth now happens in LICs, especially in Africa.

2025–2100: Growth Will Slow Down
The world may reach 10 billion people by about 2080, then stop growing.
Africa will continue to grow fastest.
Asia will start to lose population after 2050.
Europe will keep shrinking.
HICs will get older and smaller, while LICs will stay young and grow.
Future growth will mostly come from Africa and parts of South Asia.
6.1.2 Reasons for the growth and decline of a country’s population
Understanding Population Change
The number of people living in a country changes because of births, deaths, and migration.
When more people are added than removed, the population grows.
When more people die or leave than are born or arrive, the population falls.

Crude Birth Rate
Crude birth rate is the number of live babies born each year for every 1 000 people in a country.
It is called crude because it includes everyone — it doesn’t matter how old they are or whether they can have children.
A high crude birth rate means the population is growing quickly.
A low crude birth rate means growth is slowing or stable.
Examples:Niger – around 45 births per 1 000 people (very high, LIC).
Japan – around 7 births per 1 000 people (very low, HIC).

Crude Death Rate
Crude death rate is the number of deaths each year for every 1 000 people in a country.
It also includes the whole population, not just older people.
A high crude death rate can be caused by poor healthcare, war, or famine.
A low crude death rate shows good medical care, food, and living conditions.
Examples:Afghanistan – around 12 deaths per 1 000 people (LIC, limited healthcare).
UK – around 9 deaths per 1 000 people (HIC, ageing population).

Natural Increase/Decrease
Natural increase and natural decrease describe how a population changes without including migration.
Natural increase happens when the birth rate is higher than the death rate.
The population grows because more people are being born than dying.
This is common in LICs and MICs, such as Nigeria or India.
Natural decrease happens when the death rate is higher than the birth rate.
The population gets smaller because more people are dying than being born.
This is common in HICs, such as Japan or Germany, where people live longer but have fewer children.
Birth rate – Death rate = Natural increase (or decrease).

Total Fertility Rate
Total fertility rate means the average number of babies born to each woman during her lifetime.
If TFR is above 2.1, the population usually grows (replacement level).
If TFR is below 2.1, the population will shrink over time unless immigration increases.
Examples:Nigeria – TFR ≈ 5.1 (rapid growth).
China – TFR ≈ 1.2 (declining population).

Migration
Migration is when people move from one place to another to live or work.
Immigration (arriving) increases population size.
Emigration (leaving) decreases population size.
Examples:
Canada grows because many immigrants move there for work.
Syria has lost population as people emigrate to escape war.
6.1.3 An evaluation of the impacts of pro-natalist and anti-natalist policies on birth rates
Countries sometimes introduce policies to change the number of births.
Anti-natalist policies try to reduce birth rates.
Pro-natalist policies try to increase birth rates.
China is a useful case study because it has used both types of policies over the last 50 years.
Anti-Natalist Policy: China’s One Child Policy (1979–2015)
Aims
Slow down rapid population growth.
Reduce pressure on food, housing, jobs and public services.
Support economic modernisation by avoiding a huge youthful population dependency.
Key Features
Most families restricted to one child (with exemptions for rural households, ethnic minorities and later for parents who were both only-children).
Incentives for compliance: salary bonuses, better housing, priority school places.
Penalties for having extra children: fines, loss of benefits, sometimes job impacts.
Positive Impacts
Significant fall in birth rate and fertility rate.
Total Fertility Rate fell from around 2.8 (late 1970s) to about 1.6 by the 2000s.
Population growth slowed, helping to reduce pressure on resources.
Contributed to China’s economic rise, with more investment per child and higher female labour participation.
Improved access to education and healthcare for many families.
Negative Impacts
Ageing population and rising dependency ratio.
Gender imbalance due to cultural preference for sons and selective abortions.
“4-2-1 problem”: one child supporting two parents and four grandparents.
Short-term drop in labour supply in the 2010s.
Pro-Natalist Policies in China After 2015
When the government ended the One Child Policy, it introduced policies to increase birth rates.
Main Policy Changes
2015 – Two Child Policy - All couples were allowed two children.
2021 – Three Child Policy - The limit was increased to three children.
Longer maternity and paternity leave in many areas.
Financial support such as tax benefits and childcare subsidies.
Lowering education and tutoring costs (the “Double Reduction” policy).
Promoting early-years childcare and nurseries.
Public campaigns encouraging families to have more children.
Positive Impacts
A short increase in births in 2016 when the two-child policy started.
Some improvement in gender balance as restrictions relaxed.
Some regions reported more families choosing to have a second child.
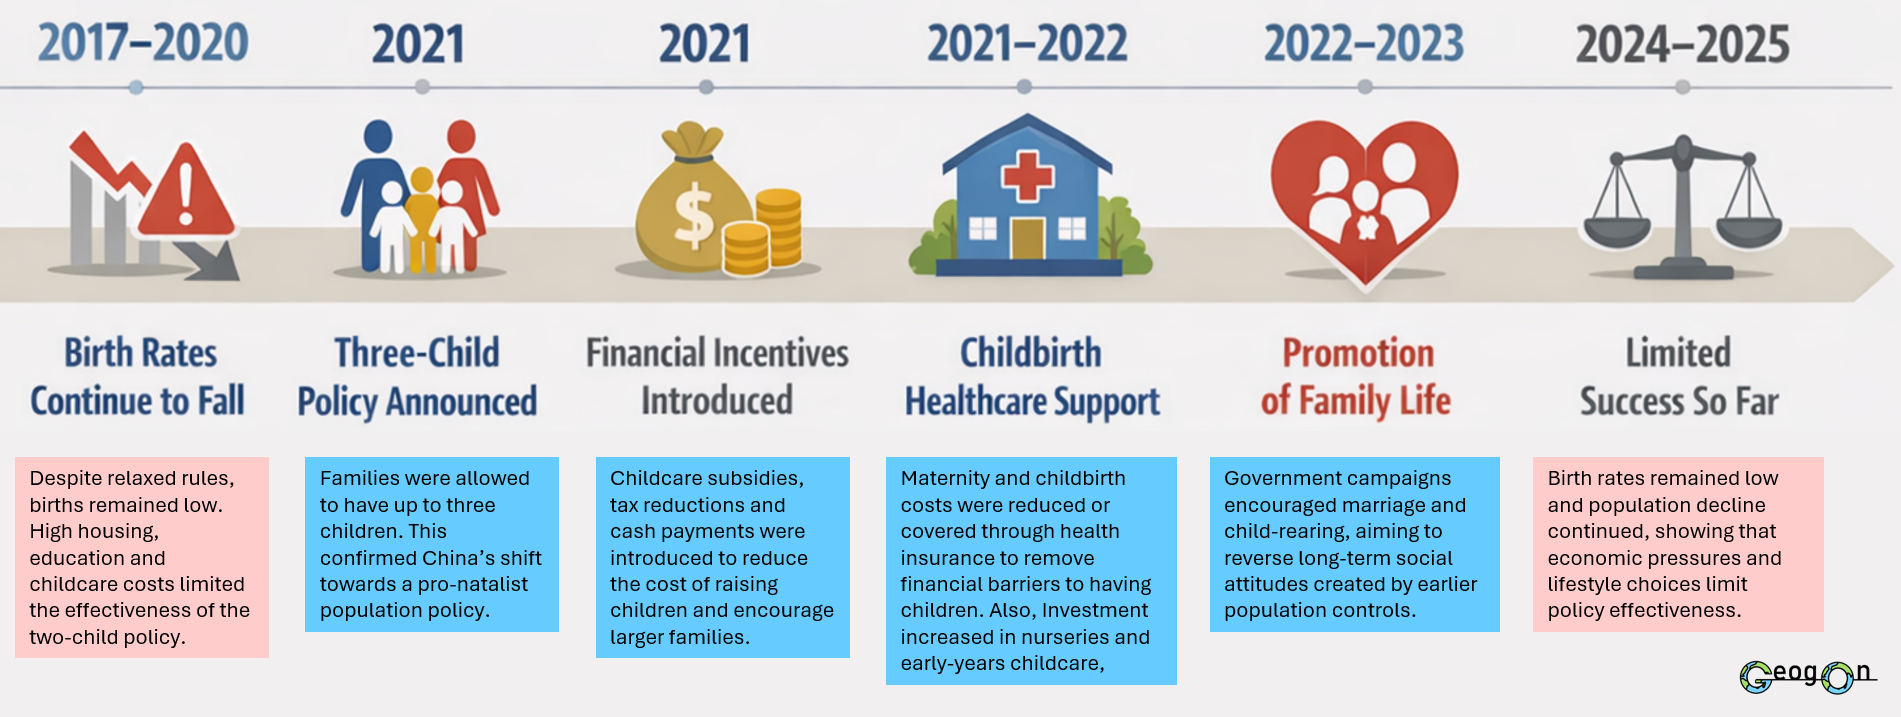
Challenges and Limited Success
Birth rates did not continue to rise. Reasons include:
High costs of housing, childcare and education.
Long working hours and job pressure.
People choosing to marry later or not marry at all.
A generation used to small families.
More women continuing education and careers.
Many couples preferring to have only one child, or none.
Current Outcomes
China’s fertility rate has fallen to around 1.0–1.2, well below replacement level (2.1).
Birth numbers continue to decline.
Population size has started to decrease.
Evaluation: What We Learn from China
Anti-Natalist Policies
Highly effective in reducing birth rates quickly.
However, they created long-term problems: an ageing population, gender imbalance, and a smaller workforce.
Pro-Natalist Policies
Less effective in raising birth rates.
Government incentives have had limited impact because social and economic pressures strongly influence family decisions.
Overall Conclusion
It is easier for a country to reduce birth rates than to increase them.
Once families become used to having fewer children, and as living costs rise, it becomes very difficult for governments to raise fertility again.
6.1.4 The demographic transition model (DTM) and its strengths and limitations.

Stage 1 – High Stationary
Description:
Both birth rate and death rate are very high.
Population size stays small and changes very little.
Reasons:
Poor healthcare and sanitation.
Frequent disease, famine, and war.
No family planning; many children die young, so families have more.
Example:
No country today, but some isolated tribal groups (e.g. parts of the Amazon rainforest).
Stage 2 – Early Expanding
Description:
Death rate falls quickly, but birth rate stays high.
Population grows very fast (population explosion).
Reasons:
Better food supply and medicine reduce deaths.
Clean water and sanitation improve.
Birth rates stay high because people still expect many children to die.
Example:
Niger, Afghanistan, Chad.
Stage 4 – Low Stationary
Description:
Both birth rate and death rate are low and balanced.
Population growth is very small or stable.
Reasons:
High living standards and strong healthcare.
Most people live in cities.
Parents often wait longer to have children.
Example:
UK, USA, France.
What is the DTM?
The Demographic Transition Model (DTM) shows how a country’s birth rate, death rate, and total population change over time as it develops.
It has five stages, from very poor countries with high birth and death rates to very rich countries with ageing or declining populations.
Key Idea
As countries develop, death rates fall first, followed later by birth rates.
This process causes the population to rise quickly, then slow, and finally stabilise or decline.
Stage 5 – Natural Decrease
Description:
Birth rate is very low, often lower than the death rate.
Population begins to shrink or age.
Reasons:
Many older people but fewer births.
High cost of living, small families, and career-focused lifestyles.
Low immigration may cause population decline.
Example:
Japan, Germany, Italy.
Strengths and Limitations of the Demographic Transition Model
Strengths
Easy to Understand – The model clearly shows how birth and death rates change as a country develops.
Useful Comparison Tool – It helps compare countries at different levels of development (LIC, MIC, HIC).
Explains Population Growth – It shows why populations grow quickly in some stages and slow down in others.
Based on Real Evidence – The model was built using real data from countries such as the UK during industrialisation.
Predictive Power – It helps show what might happen next as a country develops (e.g. when birth rates might fall).
Stage 3 – Late Expanding
Description:
Birth rate starts to fall, death rate remains low.
Population continues to grow but more slowly.
Reasons:
Family planning and contraception become available.
More education and jobs for women.
Children are expensive; families choose to have fewer.
Example:
India, Mexico, Brazil.
Limitations
Based on European Experience – The model was made from Western countries and may not fit every country’s pattern.
Does Not Include Migration – It only looks at births and deaths, not immigration or emigration.
No Time Scale – It does not show how long each stage takes; some countries move faster or slower than others.
Ignores Government Policies – Population changes can be affected by laws (e.g. China’s One-Child Policy) which the model doesn’t include.
Does Not Show Population Decline from Other Causes – War, disease, or natural disasters can reduce population suddenly, but these are not part of the model.
Not All Countries Reach Stage 5 – Some developing countries may not follow all five stages exactly.
6.2.1 Factors influencing population structures: natural increase and net migration.
What Is Population Structure?
Population structure describes how a country’s population is divided by age and gender.
It is often shown in a population pyramid.
Population structure changes over time, depending on births, deaths and migration.
What Is a Population Pyramid?
A population pyramid is a graph that shows the age and gender structure of a country’s population.
The horizontal axis shows the number or percentage of people.
The vertical axis shows age groups, usually in five-year bands.
Males are shown on the left side.
Females are shown on the right side.
Each bar represents the size of that age group for each gender.

Young Dependents
People aged 0–14.
They are usually in full-time education and not working, so they rely on others for support (food, housing, healthcare, education).

Economically Active
People aged 15–64 who are working or able to work.
This group earns money, pays taxes and supports both young and elderly dependents.


Elderly Dependents
People aged 65 and over.
Most are retired and no longer in full-time work. They depend on others and the government for pensions, healthcare and support.
6.2.2 The causes and impacts of youthful and ageing population structures, and an evaluation of their impacts.
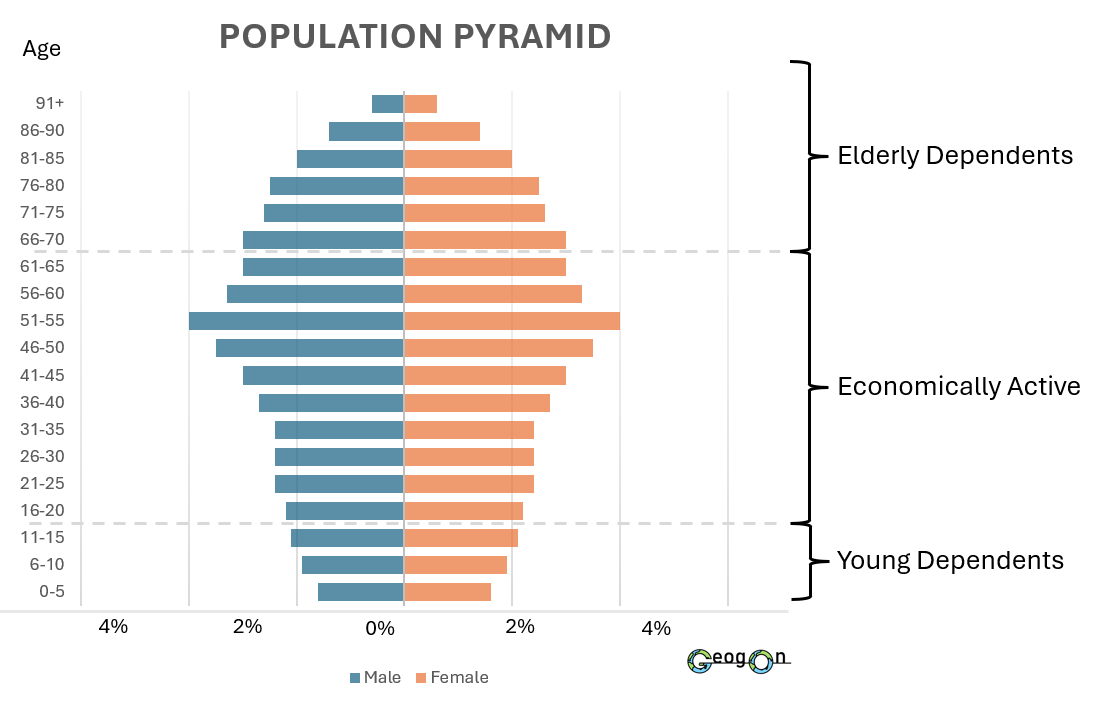
Aging Population
What does an ageing population pyramid look like?
Typical features of an ageing population (often high-income countries):
Narrow base
Low birth rate, fewer children being born.Thick middle and top
Many adults and a large elderly group (wide upper part of pyramid).Slight inward curves in younger adult groups if lots of women delay having children or if migration patterns change.
Why do ageing populations happen?
Falling birth rates
Better education and careers for women
Higher cost of living (housing, childcare)
Contraception easily available
Couples choosing to have fewer children or have them later
Result: fewer babies → smaller young population → higher average age.
People living longer
Better healthcare and medicines
More vaccinations and public health (clean water, sanitation)
Higher living standards: better diet, safer jobs, less physically demanding work
Result: more people survive into old age.
Migration patterns
Young adults may emigrate for work to other countries.
If not many young migrants move in, the country is left with more elderly in the structure.
Social impacts
Challenges
Pressure on healthcare services
More hospital visits, long waiting lists, pressure on doctors and carers.Pressure on care homes and family care
Families may have to look after older relatives at home. This can be stressful and time-consuming.Changing community structure
More elderly people, fewer young children in schools, some villages or towns may feel “older” and less dynamic.
Benefits
Grandparents help with childcare, housework, passing on culture and traditions.
Many retired people volunteer in local charities, clubs and community groups.
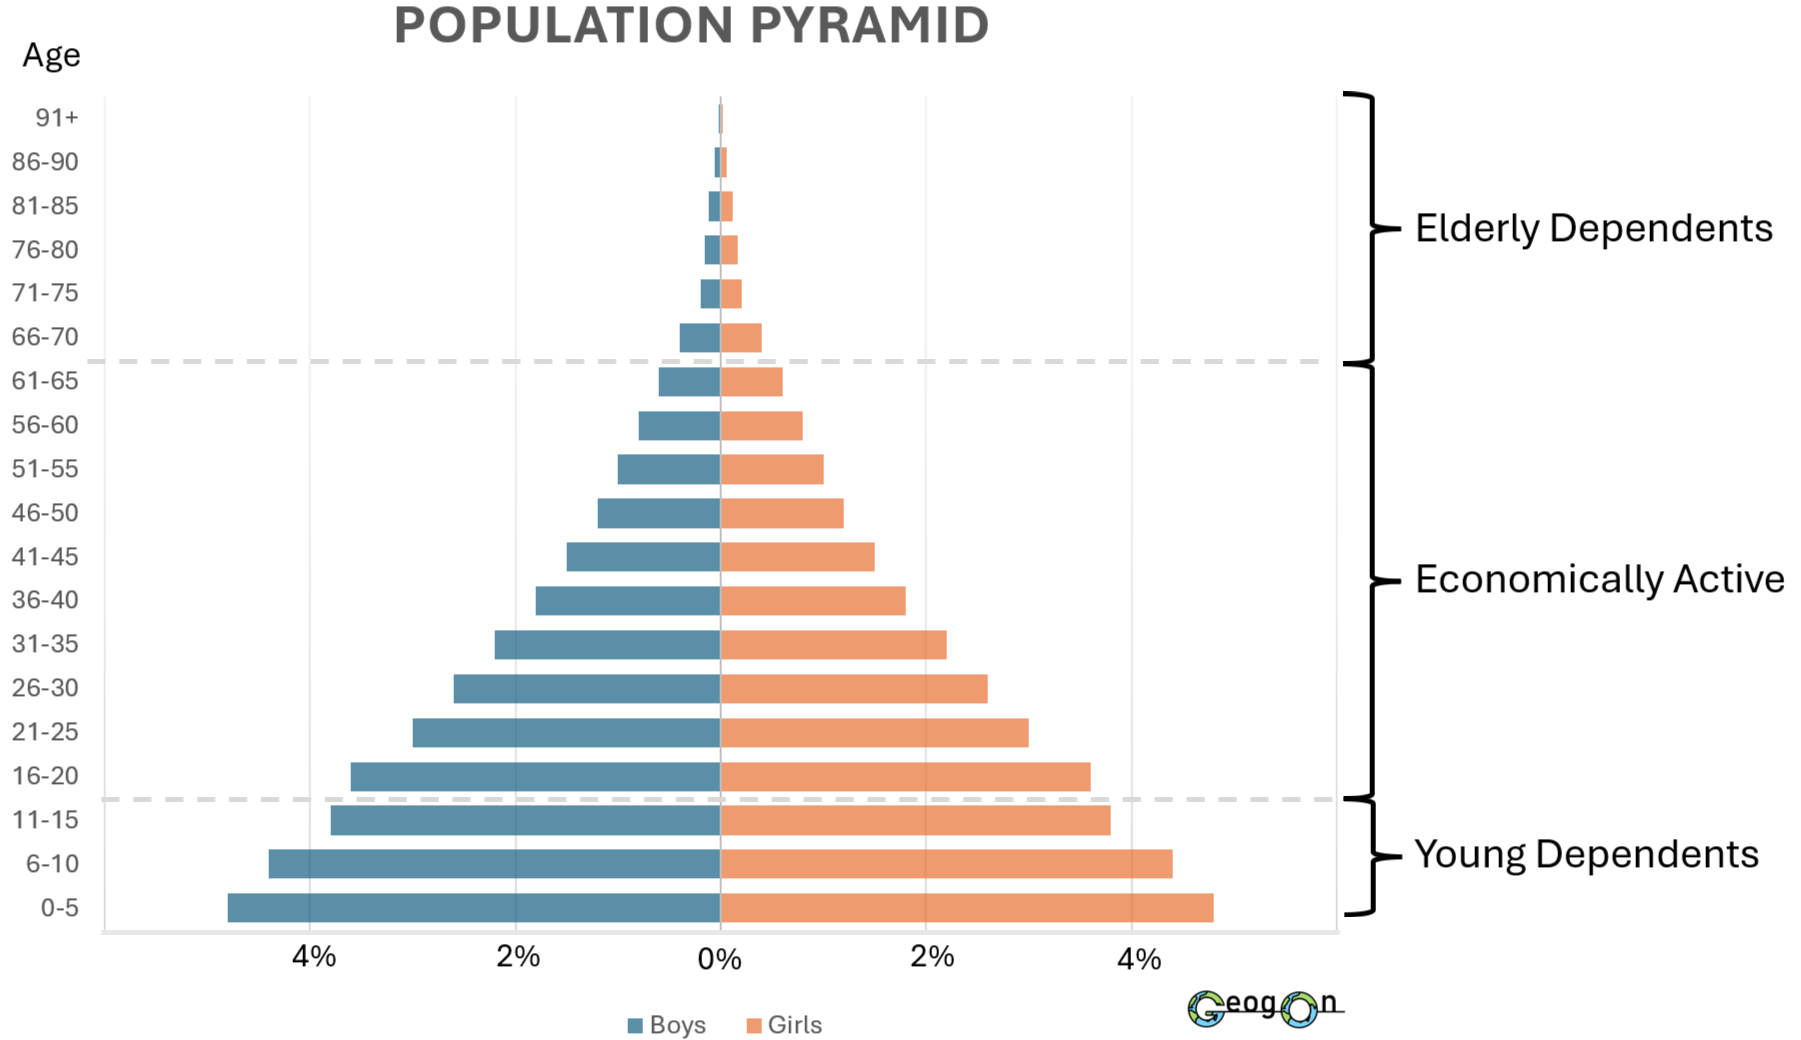
Youthful Population
What a Youthful Population Pyramid Looks Like
Very wide base - High birth rate, many babies and children being born each year.
Steady narrowing up the pyramid - Higher death rates in older age groups means fewer people survive to older ages.
Short top section - Low life expectancy.
Balanced male–female shape - Most youthful populations have limited long-term migration effects, so the sides are usually symmetrical.
Why Youthful Populations Occur
High birth rates
Limited access to contraception
Traditional views on family size
Children seen as economic support
Early marriage
Limited education for women
Falling death rates
Improvements in basic healthcare
Vaccinations and better nutrition
Safer water and sanitation
Migration patterns
Limited emigration of young people
Minimal immigration of older populations
Social impacts
Challenges
Pressure on schools, teachers and class sizes
Pressure on healthcare, especially for mothers and infants
Risk of overcrowding in rapidly growing cities
High demand for housing and basic services
Benefits
Large potential future workforce
Greater innovation and energy in communities
Possibility of a demographic dividend if education and jobs improve
Economic impacts
Challenges
Higher pension costs
Government spends more money each year on state pensions.Higher healthcare spending
More money needed for hospitals, medical staff, social care.Smaller workforce
Fewer working-age adults may lead to labour shortages and slower economic growth.Higher taxes
Workers may pay higher taxes to fund pensions and healthcare.
Benefits
A “silver economy - Businesses providing tourism, leisure, healthcare, and specialised products for older people can grow.
Demand for new jobs - More work in healthcare, care homes, mobility services, etc.
Economic impacts
Challenges
Government must spend heavily on education, health and childcare
Fewer taxpayers per dependant → high dependency ratio
Risk of youth unemployment
Difficulty breaking out of a cycle of poverty if job growth is slow
Benefits
Future economic growth if the young population becomes skilled
More domestic market demand when they reach working age
6.2.3 One detailed specific example of a named country
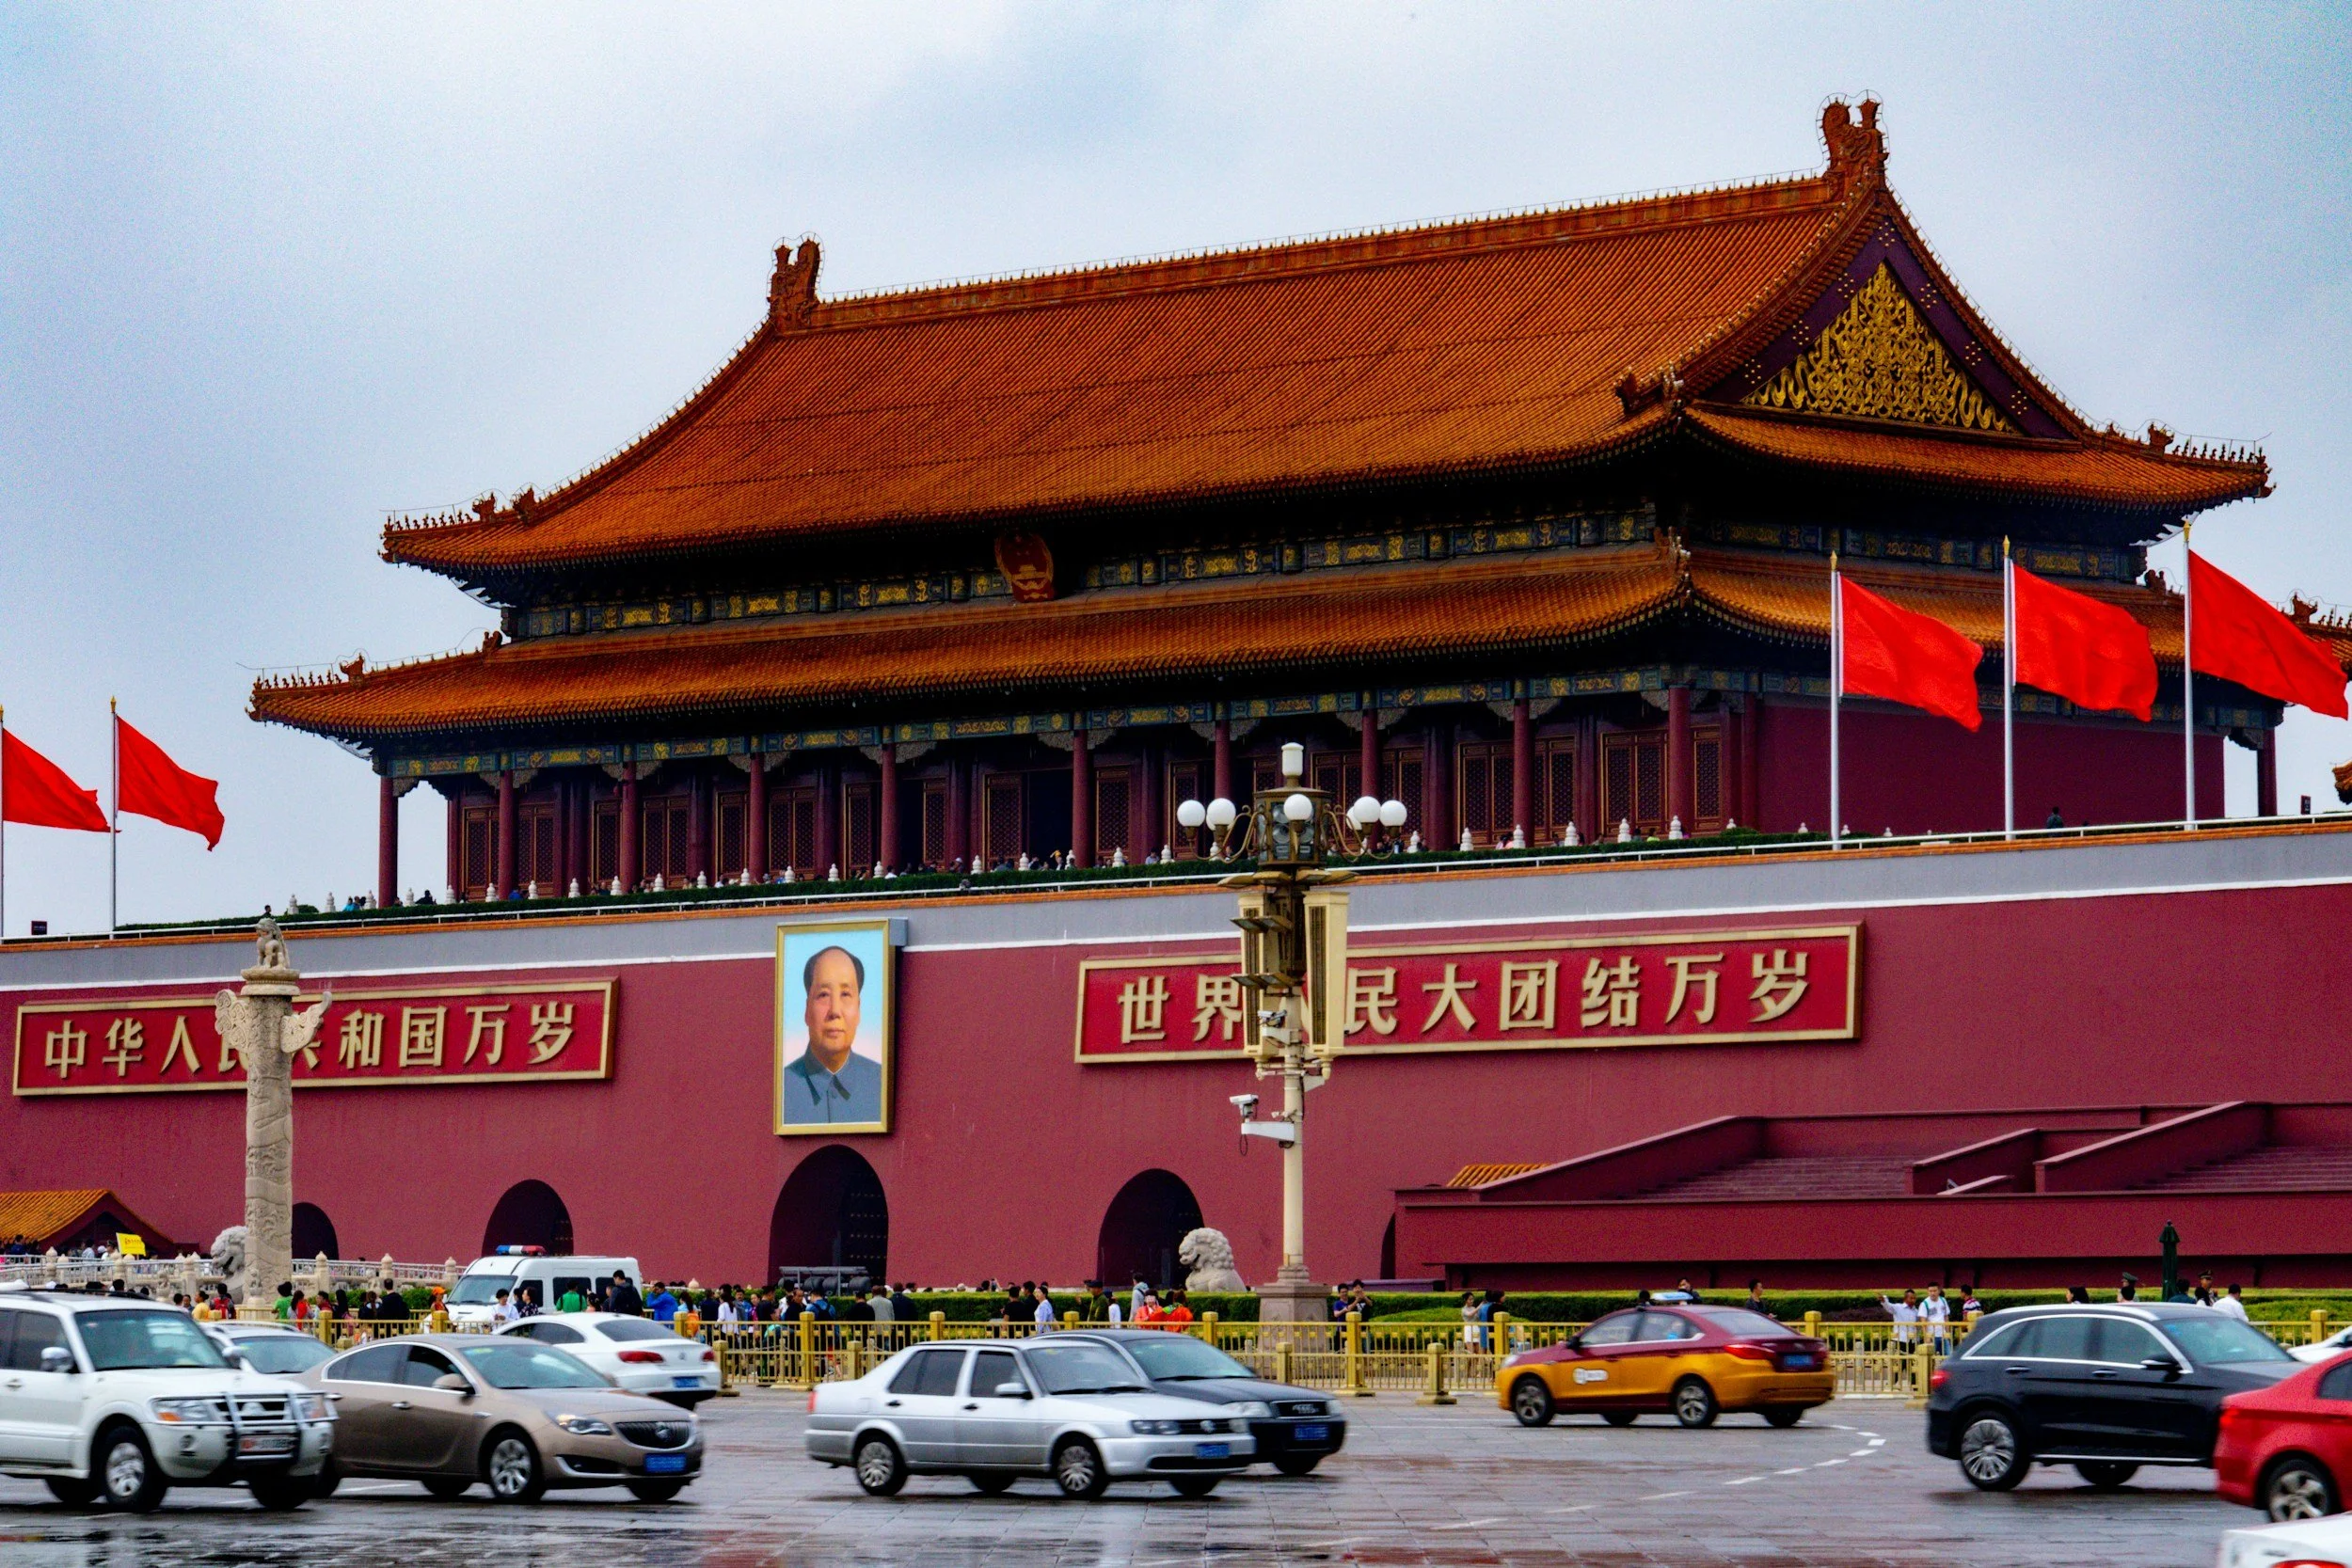
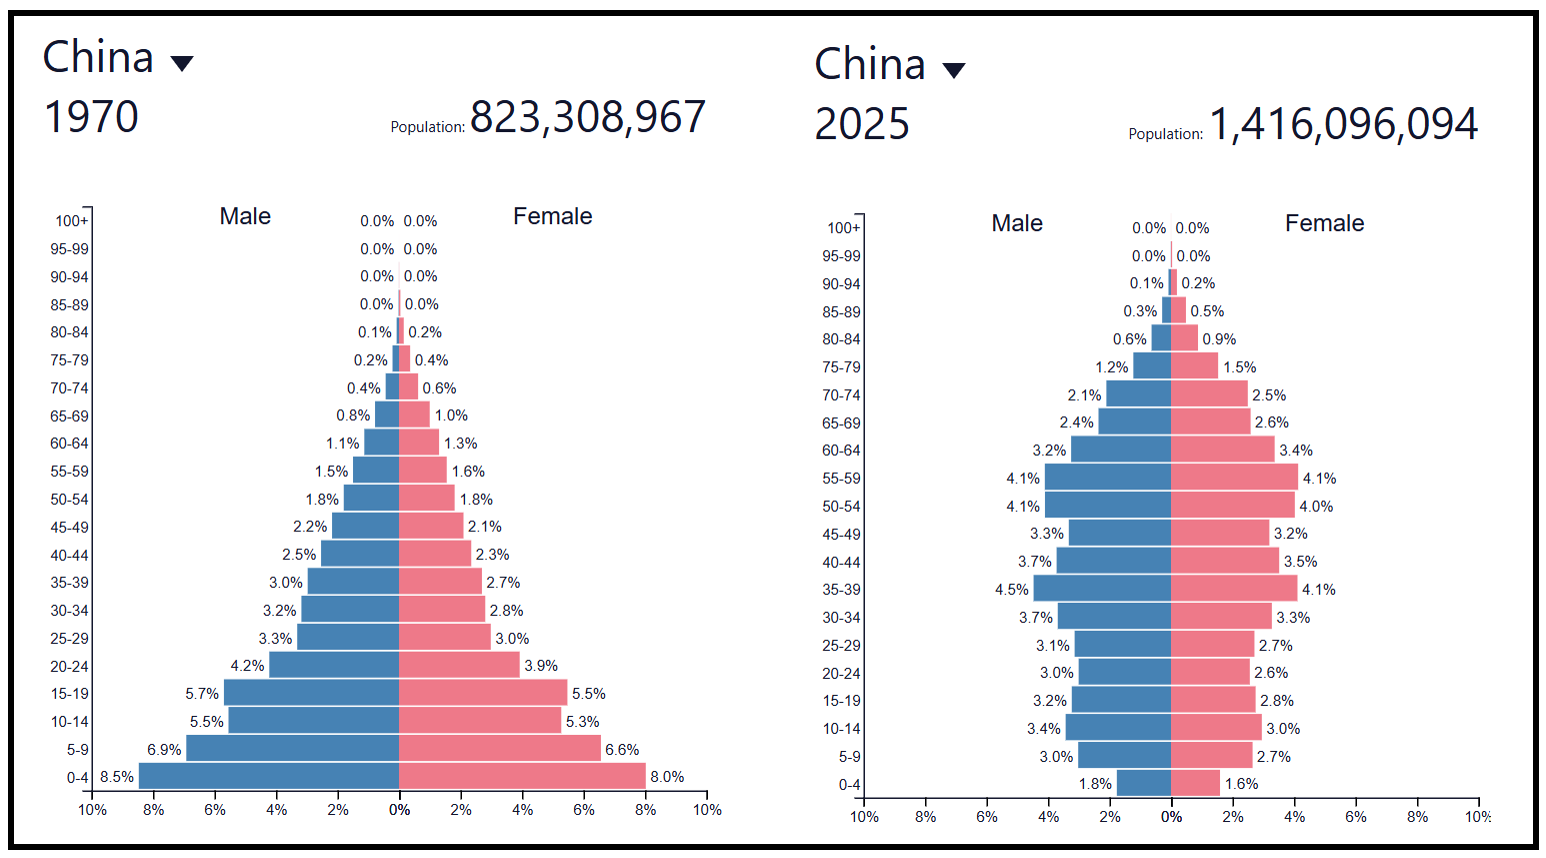
China
Reasons for population growth
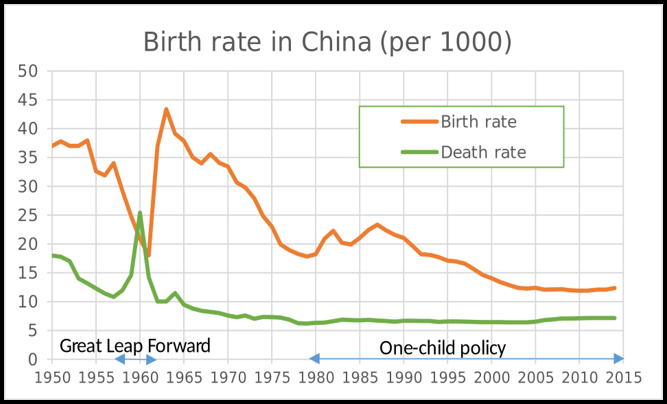
•Before 1960, families in China were encouraged to have as many babies as possible. The birth rate was 5.1 babies per woman and the population reached 600m!
•However, between 1959-61 – The Great Chinese famine (extreme lack of food) occurred – killing 30 million people
•A baby boom (huge increase in population) followed as the birth rate reached 45/1000
•However, the government thought the population was growing at an unsustainable rate and were worried another disaster could repeat itself if there were too many people
•So in 1979, the government decided to step in and introduced a controversial “One-Child” policy to limit population growth.
The One-Child Policy, introduced nationwide in 1979, was China’s major anti-natalist strategy designed to slow extremely rapid population growth. The policy limited most urban couples to one child, while allowing some exceptions: rural families could apply for a second child if the first was a girl, ethnic minority groups were usually permitted more than one child, and later, certain provinces allowed two children if both parents were only children themselves. The policy worked through a mix of incentives and penalties.
Incentives
(rewards for following the One-Child Policy)
Better housing allocation
Access to newer or larger apartments.Priority school places
Easier access to good nurseries and schools.Higher salary or bonus payments
Extra pay for government workers who followed the policy.Longer maternity leave
More time off for mothers after giving birth.Free or cheaper healthcare
Medical support for mothers and children.“One-Child Certificate” benefits
A package of small financial rewards and local privileges.
Since 2021, China has introduced a range of pro-natalist policies following the end of strict birth limits. These include financial incentives, healthcare support and expanded childcare, although their impact on birth rates has so far been limited.

The One-Child Policy (1979): Anti-Natalist Policy
Penalties
(punishments for breaking the policy)
Social Compensation Fee
A large fine charged for unauthorised births.Loss of job benefits
Reduced wages, fewer bonuses or loss of promotion for state workers.Reduced access to housing or schooling
Families who broke the rules could be denied preferred housing or school places.Extra childcare and education costs
Parents sometimes had to pay the full cost for childcare or schooling for the second child.Monitoring and strict family-planning checks
Mandatory pregnancy checks and registration with local officials.
China from 2021 onwards : Pro-Natalist Policies


Impacts of the One-Child Policy
Positive outcomes
Birth rate fell sharply.
Population growth slowed, helping reduce pressure on services.
China avoided severe food shortages.
More investment in each child’s education and healthcare.
Negative outcomes
Ageing population: fewer young people, more elderly dependants.
Gender imbalance: cultural preference for boys led to more male births.
Shrinking workforce: fewer working-age adults to support the economy.
“4–2–1” family structure: one child expected to care for two parents and four grandparents.
By the 2010s, the government realised the population was ageing too quickly and labour shortages were growing.
6.3.1 Types of migrant: economic migrant, asylum seeker and refugee.
Not all migrants are the same. People move for different reasons and in different ways. Some migrants choose to move voluntarily for work, education or a better quality of life, while others are forced to leave due to conflict, persecution or natural disasters. Migration can take place within a country or across international borders, and understanding these differences is important when explaining population change.
Types of Migration – Key Categories

By Choice
Voluntary migration
Economic migrant
These migrants choose to move, usually to improve their quality of life, income or opportunities.
By Force
Involuntary migration
Refugee
Asylum seeker
These migrants are forced to move due to war, persecution, violence or environmental hazards.
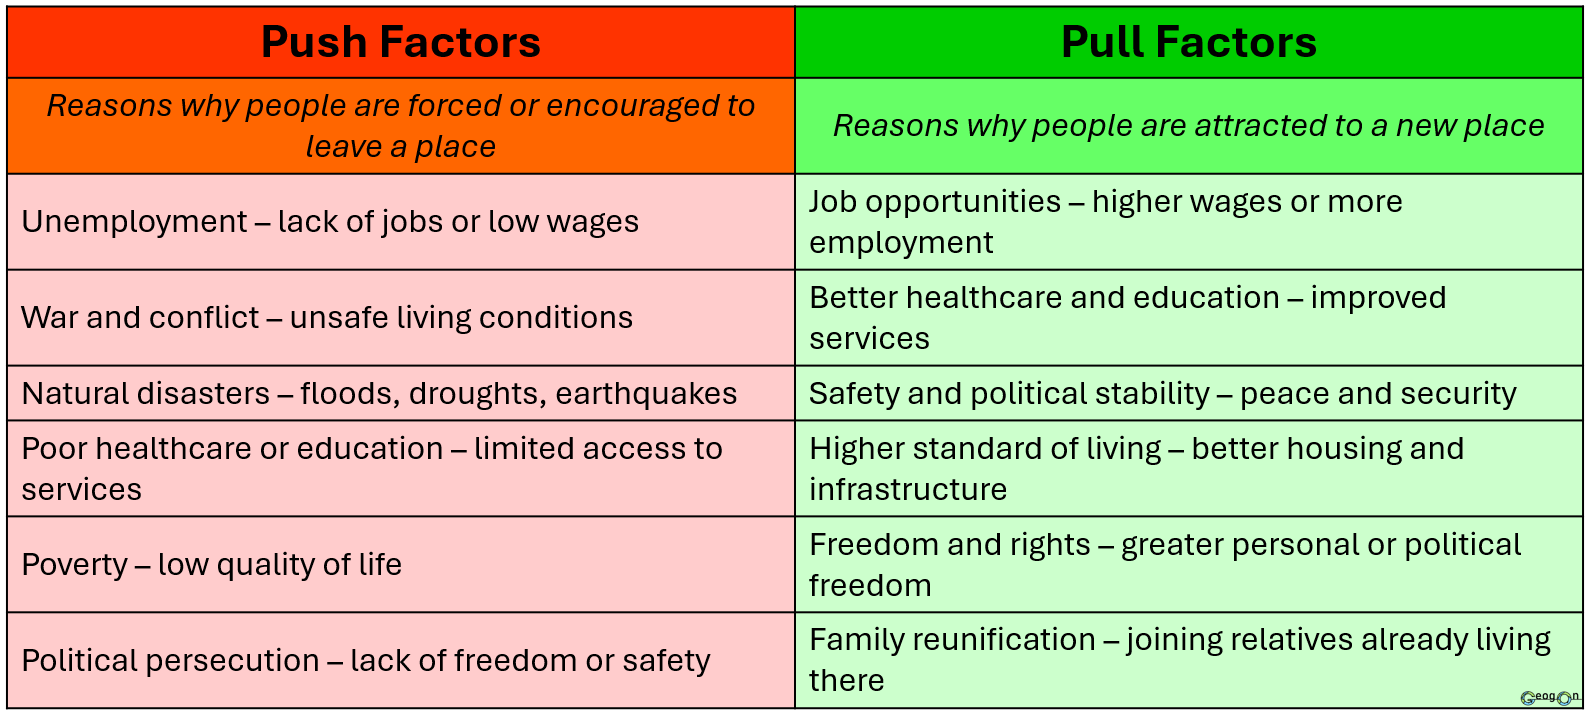
Push and Pull Factors
Migration happens because people are pushed away from their home area or pulled towards a new place. Most migration decisions are influenced by a combination of both push and pull factors.
Push factors are the negative conditions that cause people to leave a place, such as unemployment, conflict or natural disasters.
Pull factors are the positive attractions of a place that encourage people to move there, such as job opportunities, better services or greater safety.
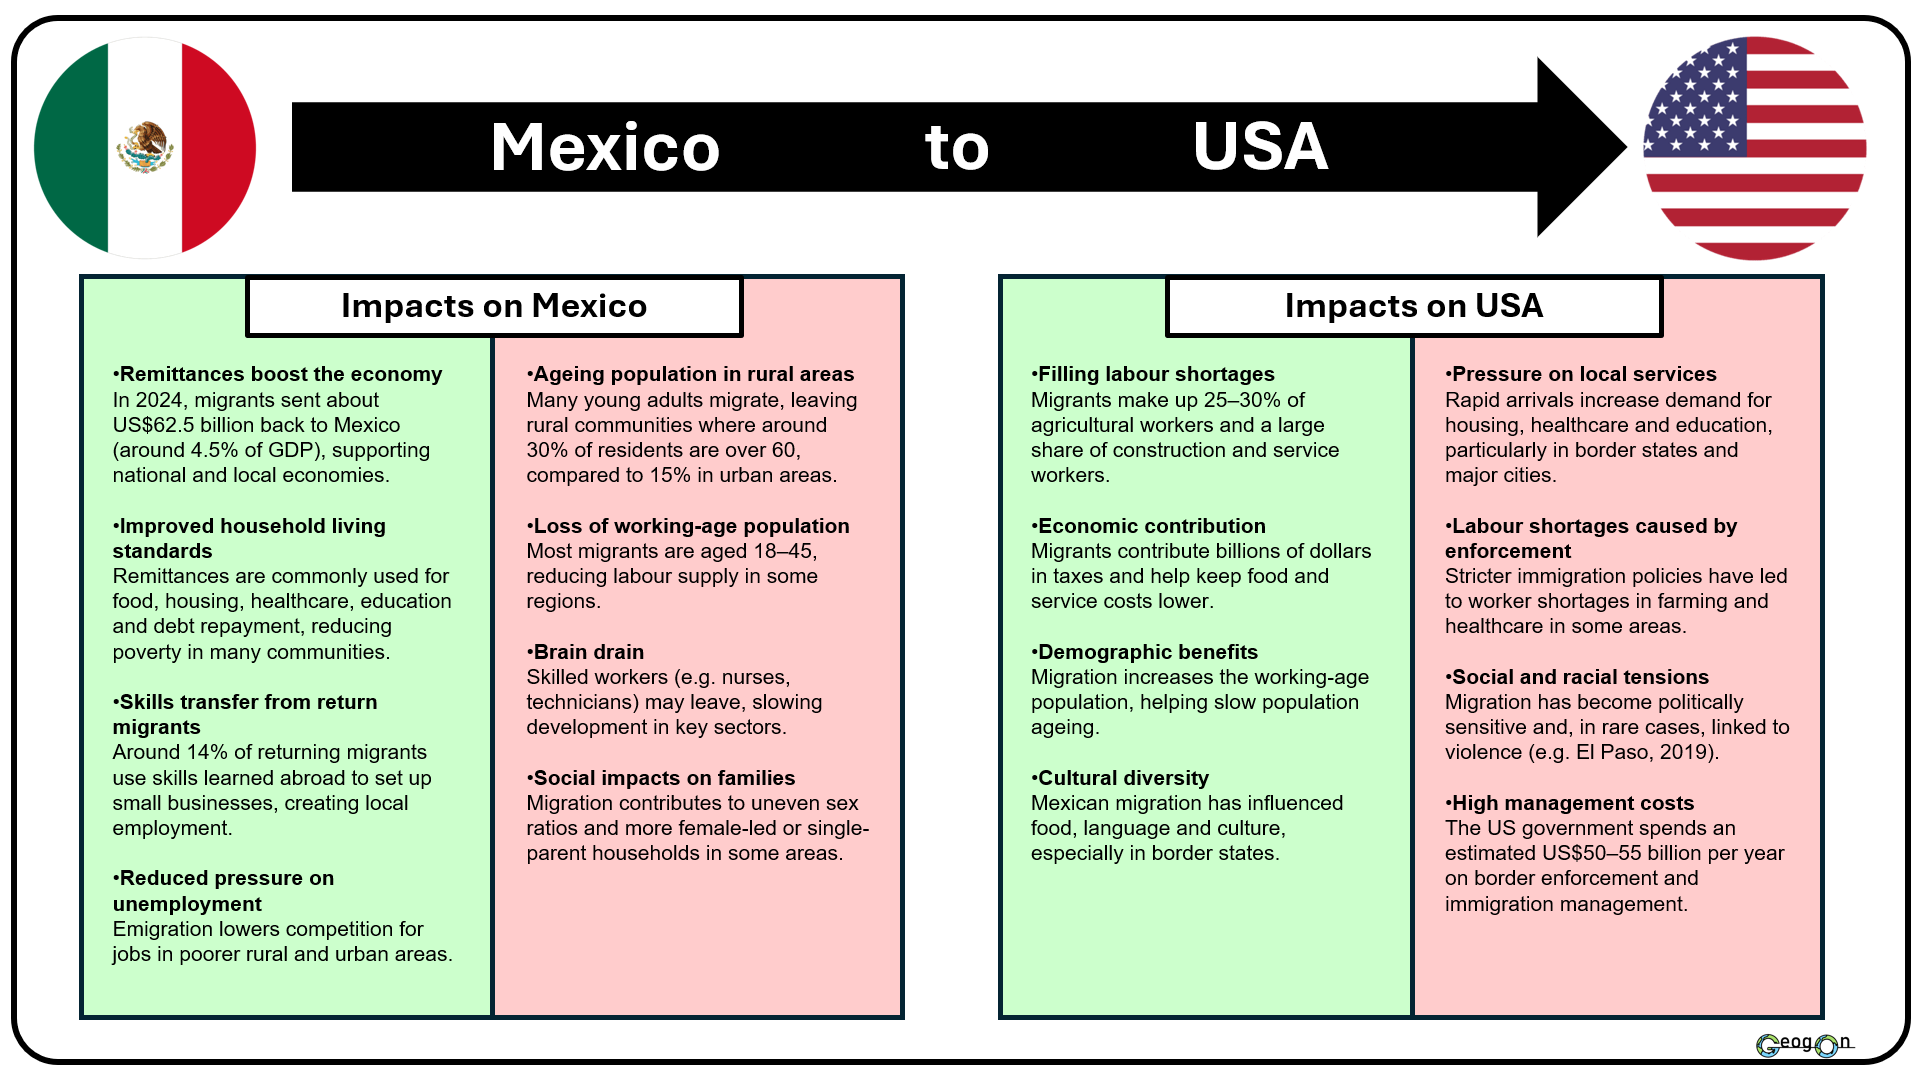
Impacts on the Country of Origin
Positive impacts
Remittances – money sent home by migrants supports families and local economies
Reduced unemployment and pressure on services
Skills gained abroad may return if migrants come back
Negative impacts
Brain drain – loss of young, skilled workers
Reduced workforce and productivity
Ageing population as working-age people leave

6.3.3 The impacts of migration on the migrant, their country of origin and the destination country.
Migration can have both positive and negative impacts. For migrants, moving may improve income, safety and quality of life. The country of origin (the country people migrate from) may benefit from remittances, but can suffer from brain drain as skilled workers leave. The host or destination country (the country migrants move to) often gains workers to fill labour shortages, but may experience increased pressure on housing, healthcare and other services.
Impacts on the Migrant
Positive impacts
Better job opportunities and higher income
Improved access to healthcare and education
Increased safety and security
Improved quality of life
Negative impacts
Separation from family and friends
Language and cultural barriers
Discrimination or social exclusion
Poor living or working conditions

By Distance / Scale
Internal migration
International migration
These terms describe whether migration happens within a country or across national borders.
6.3.2 Causes of migration, to include push and pull factors.
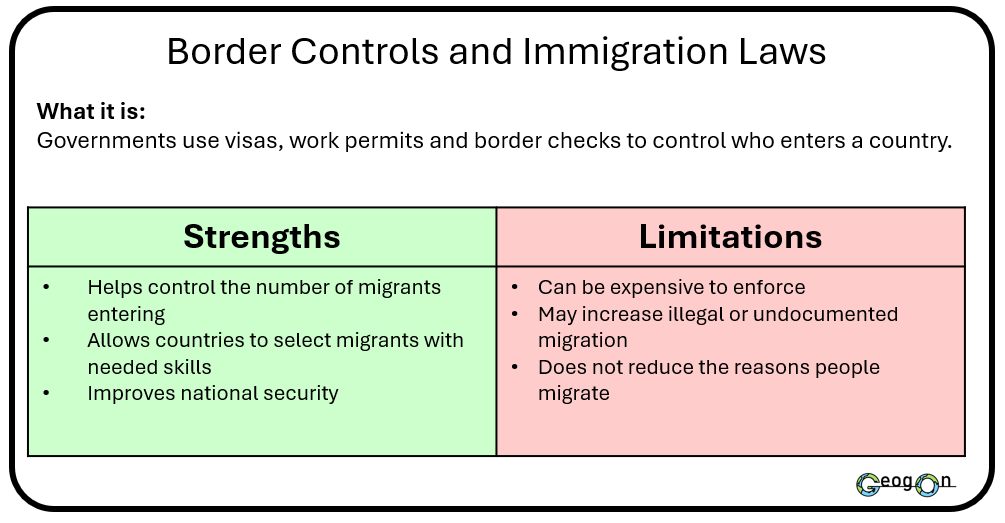
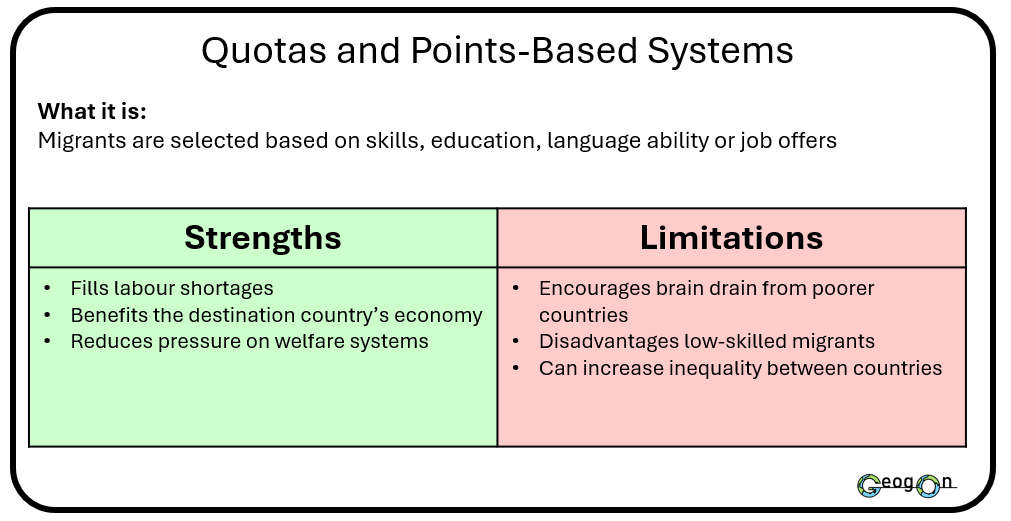
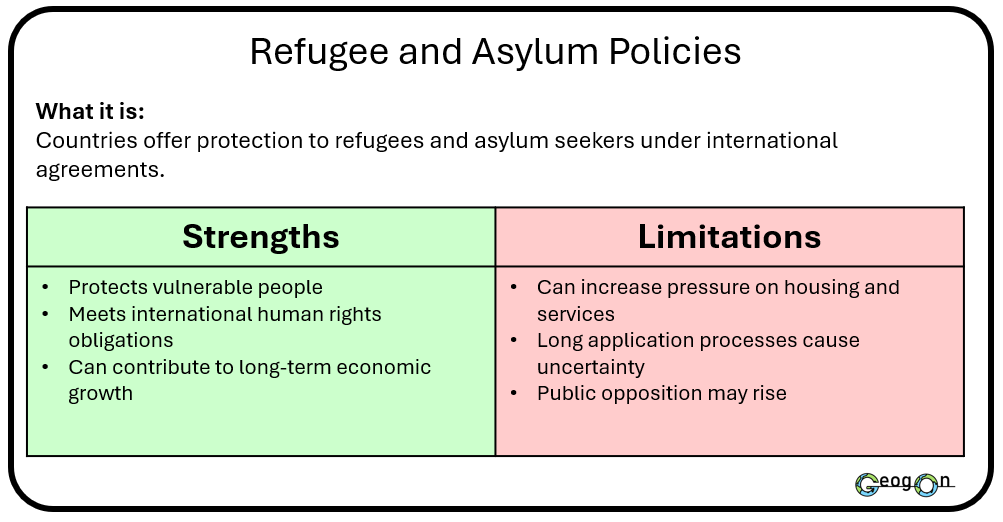
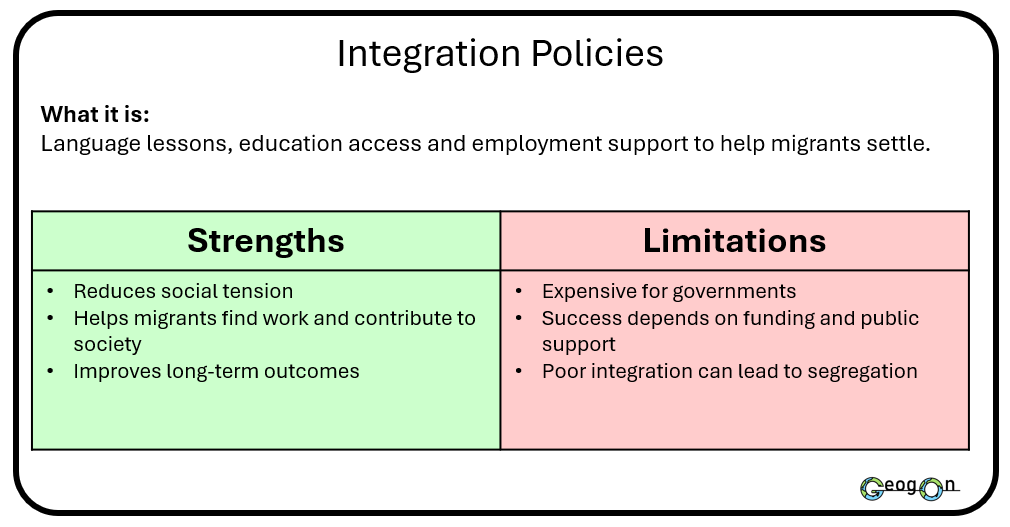
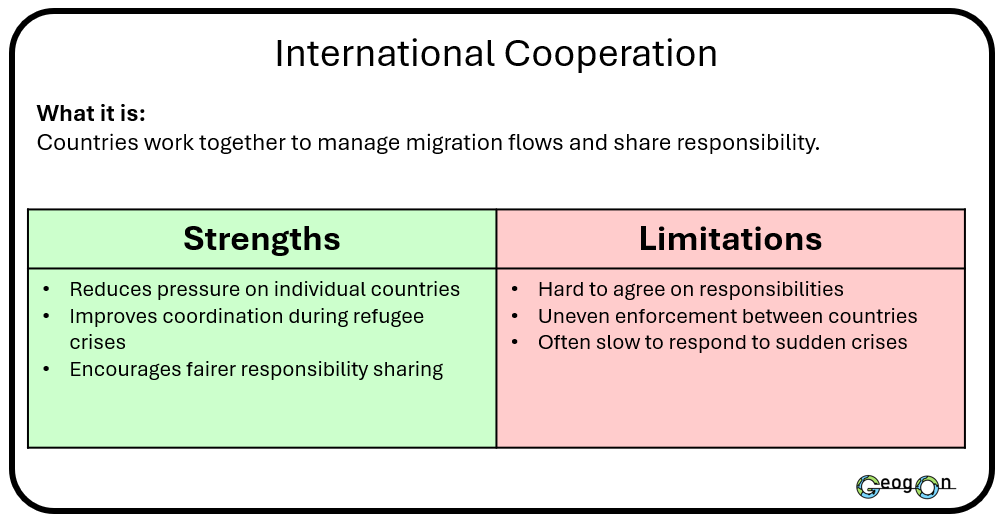
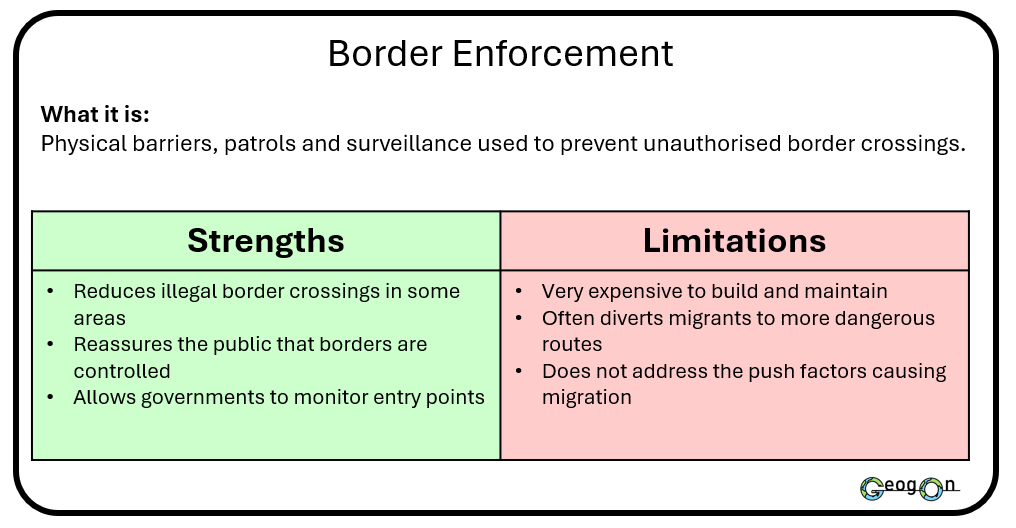
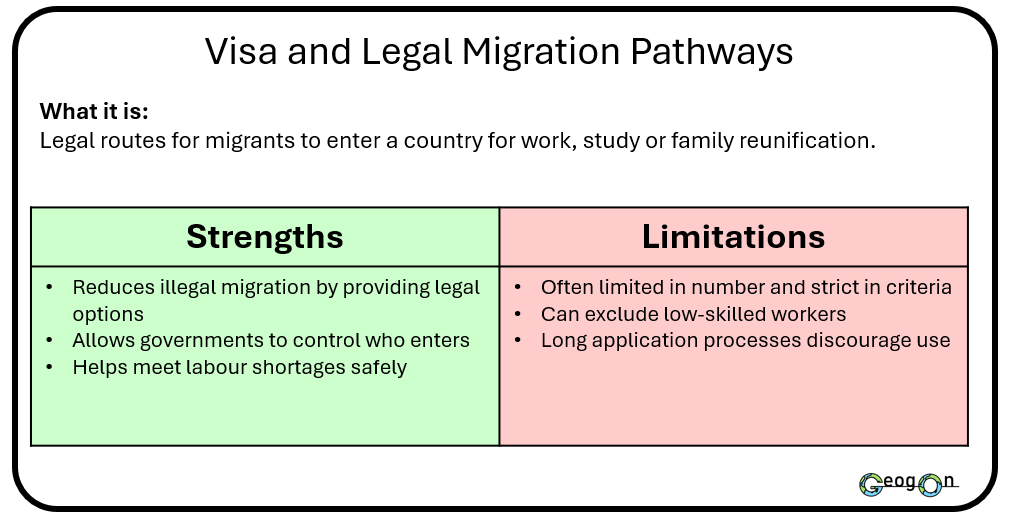
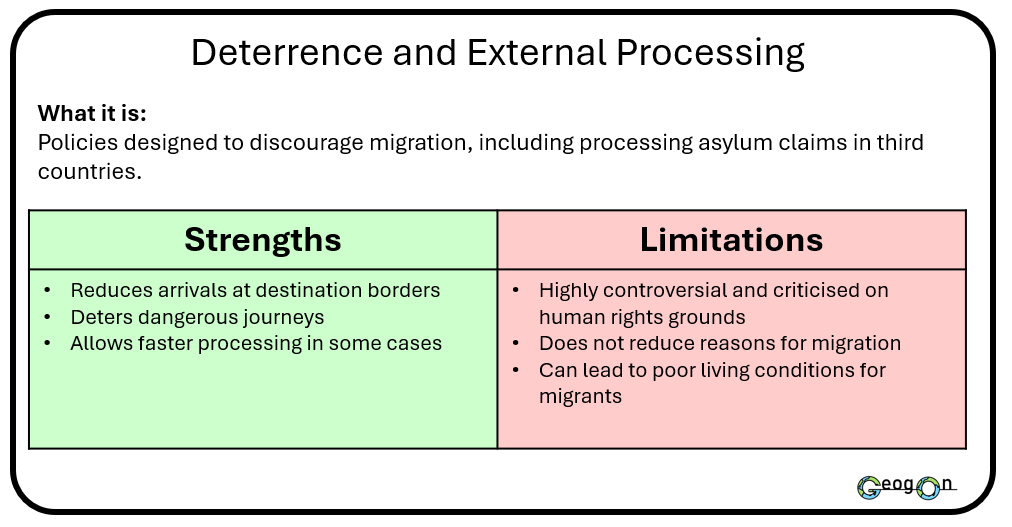
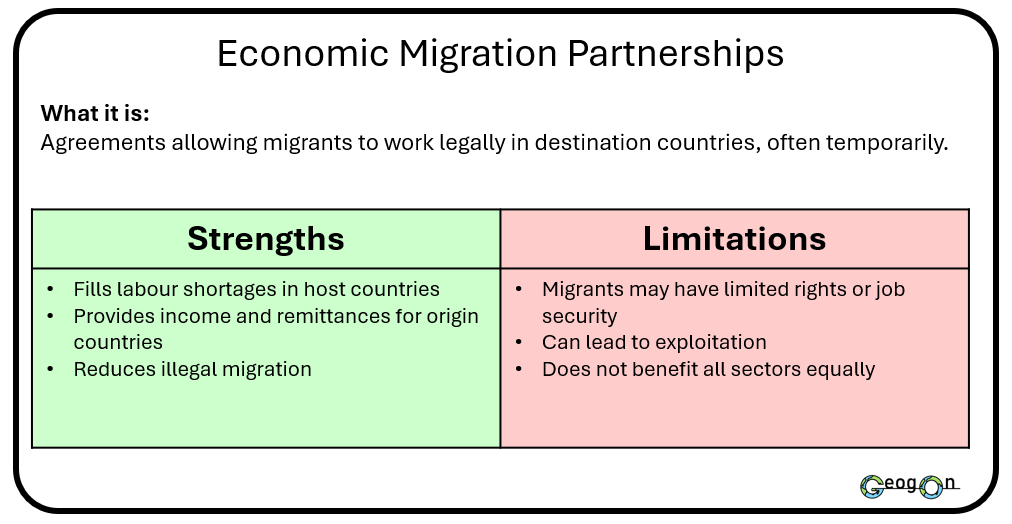
Governments use a range of methods and techniques to manage international migration, including border enforcement, visa systems and international agreements. These strategies aim to control migrant numbers, protect national security and meet economic needs. However, each approach has strengths and weaknesses. Some methods are effective at reducing arrivals but do not address the reasons people migrate, while others support long-term management but are costly or politically challenging.
By Direction
Immigration
Emigration
These terms describe whether people are moving into or out of a country.
Impacts on the Destination Country
Positive impacts
Increased workforce to fill labour shortages
Economic growth and higher tax revenue
Cultural diversity and new skills
Negative impacts
Pressure on housing, healthcare and schools
Increased competition for jobs
Social tension or conflict if integration is poor
6.3.4 An evaluation of the strategies and techniques used to manage international migration.
6.3.5 One detailed specific example
Example to include:
• push and pull factors of a named international migration (named to include the country of origin and destination country)
• the impacts of the migration (on the migrants, their country of origin and the destination country)
• how the migration is managed; including sustainable.
Mexico to USA Case Study