Cartographic Skills

16 Point Compass

How to Read Directions
Always pay attention to the starting point and the destination in the question.
Read prepositions carefully:
“From” tells you where you are starting.
“To” tells you where you are going.
Imagine (or lightly draw) a line from the starting place to the destination.
Match this line to the nearest compass point on the 16-point compass.
Example:
If the question says “What is the direction from the school to the bridge?” → begin at the school, draw a line to the bridge, then state the compass direction (e.g. SE).
Exam Hint: If you’re not confident, give the nearest main 8-point compass direction (e.g. NE instead of ENE). You’ll usually still gain credit, but aim for 16-point precision when possible for top marks.
Coordinates - Latitude and Longitude
What are Coordinates?
Coordinates are a way of giving the exact position of any place on Earth.
They are written as two numbers:
Latitude (first, north/south)
Longitude (second, east/west).
Example: (51°N, 0°W) is London.

Latitude
Lines of latitude run horizontally around the Earth.
They measure the distance north or south of the Equator (0°).
The Equator splits the Earth into the Northern Hemisphere and Southern Hemisphere.
Important latitudes:
Equator (0°)
Tropic of Cancer (23.5°N)
Tropic of Capricorn (23.5°S)
Arctic Circle (66.5°N)
Antarctic Circle (66.5°S)
How They Work Together
A latitude and longitude pair pinpoints one exact spot on the globe.
Think of it like playing Battleships:
Latitude tells you the row (north/south).
Longitude tells you the column (east/we

Longitude
Lines of longitude run vertically from the North Pole to the South Pole.
They measure the distance east or west of the Prime Meridian (0°), which runs through Greenwich, London.
Longitude values go up to 180° East and 180° West.

Test yourself
-
![A world map with continents labeled and the Prime Meridian passing through Europe and Africa. There are red circles with white letters marking specific locations, including points in North America, South America, Africa, Europe, Asia, Australia, and Antarctica.]()
Try to work out the coordinates for the letters
Click the arrows to reveal the answers
-
![A world map with latitude and longitude lines and labels for the Prime Meridian and Equator. It highlights specific geographic points with red labels and coordinates, including points in North America, South America, Africa, Europe, Asia, Australia, and Antarctica.]()
How did you do?
Keep trying until you can get all of them correct.


Grid References

The A B C of finding 4 figure grid references
Imagine you are trying to tell someone where to find the “G” on the grid. Follow the steps below to find out how you could give them 4 numbers that would lead them right to it!
A - You must always find the bottom left corner of the grid square that contains the feature you are looking for.
B - Then you need to identify the vertical line that meets the bottom left corner of the grid square. This gives you your first 2 digits. in this case.
0 3 _ _
C - Finally you need to identify the horizontal line that also meets the bottom left corner of the grid square. This gives you your final 2 digits. In this case they would be.
_ _ 0 4
Combine the 4 digits an you have a 4 figure grid reference.
G = 0304

The A B C of finding 6 figure grid references
Imagine you are trying to tell someone where to find the “G” on the grid. Well, it’s smaller this time, if you gave somebody the grid reference 0202 they could easily miss it! Follow the steps below to find out how you could give them 6 numbers that would lead them right to it!
A - Start by finding the 4 figure grid reference for the bottom left corner of the grid square, this time leave space for another number after each set of numbers.
0 2 _ 0 2 _
B - Next you need to imagine a grid within the big square, this should be a 10x10 grid. You then need to estimate how many small vertical lines across the “G” is. In this case the middle of the “G” is half way so it would be 5 small lines across. The vertical red line indicates this. This means your 3rd digit would be 5!
0 2 5 0 2 _
C - Finally you need to identify the small imaginary horizontal line that also passes through the middle of the “G”. In this case it is also half way across the large square so it would be approximately 5. This is also indicated by the horizontal red line. You them simply put your final digit on the end of your grid reference.
0 2 5 0 2 5
In a test setting you are allowed +/- 1 on the 3rd and 4th digit so all of the below would also be accepted.
0 2 6 0 2 5 0 2 6 0 2 6 0 2 5 0 2 6 0 2 5 0 2 4 0 2 4 0 2 4 0 2 6 0 2 4 etc…
Bearings
What is a Bearing?
A bearing is a way of describing direction using angles.
Bearings are always measured clockwise from North.
They are written as a three-figure number (e.g. 045°, 120°, 270°).
How to Work Out a Bearing
Look at the example to the right. This shows the bearing from A to B.
Start at the first location in the question (A).
Draw a line straight up to show north.
Draw a line to the destination point (B).
Measure the angle clockwise from north to this line.
Write the answer as a three-figure bearing (e.g. 045°, not just 45°).
Exam Tips
Always use a protractor for accuracy.
Double-check you measured clockwise from north (not anticlockwise).
Don’t forget the leading zero (e.g. 045° not 45°).

Test yourself
-
![A circular compass with degrees marked around the edge, a red needle pointing north, and several labeled points around the compass including F, G, H, E, D, C, and B in black circles with red lettering.]()
Try to work out the bearings from A to the other letters
Click the arrows for help and the answers
-
![A compass rose with a central point labeled 'A,' multiple black lines radiating outward, each connecting to points labeled B, C, D, E, F, G, H, and 'N' at the top. The lines are marked with degrees from 0 to 360, and the outer circle has degree markings as well.]()
These lines should help
Click again for the answers
-
![A circular diagram with a central point labeled 'A' connecting to points labeled B, C, D, E, F, G, and H, each with an associated angle in degrees. The diagram includes a compass with North marked at the top, and angles connecting points are noted with measurements like 45°, 109°, 150°, 208°, 250°, 294°, and 339°.]()
Check your answers
How did you do?


Scale and Measuring Distance
What is Scale?
Scale tells you how distances on a map relate to real distances on the ground.
It shows the ratio between map distance and actual distance.
Scales may be shown in three ways:
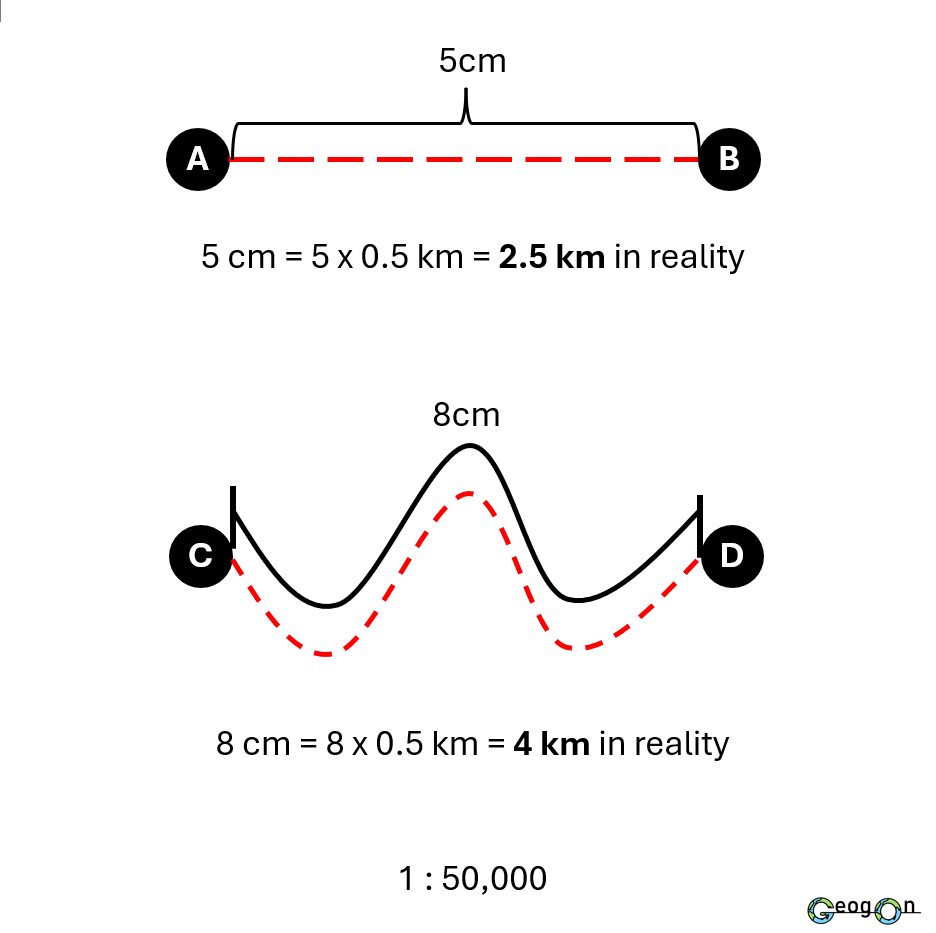
Ratio / Representative Fraction (RF): e.g. 1:50,000 (1 cm on the map = 50,000 cm = 0.5 km in real life).
Statement: e.g. “1 cm = 500 m”.
Line scale (bar scale): a graphic scale printed on the map.
Measuring Straight-Line Distances
Place a ruler between the two points.
Measure the distance in cm or mm.
Multiply by the scale to convert into the real ground distance.
Example:
Between point A and B, on a 1:50,000 map, 5 cm = 5 × 0.5 km = 2.5 km in reality.
Measuring Curved Distances (e.g. roads, rivers)
Use a piece of string or the edge of paper to trace the curve.
Straighten the string and measure the total length.
Convert using the scale (same as above).
Example:
Measure the curve: Use a piece of string or edge of paper to follow the dotted line from C to D.
The dotted line between C and D is 8cm.
On a 1:50,000 map, 8 cm = 8 x 0.5 km = 4 km in reality
Exam Tips
Always show your working (e.g. “4 cm × 0.5 km = 2 km”).
Watch the units – convert cm → km or m as required.
If a line scale is given, you can measure directly against it for accuracy.
Estimating Area
On this map each grid square is 4cm by 4 cm.
It has a scale of 1:25000.
4cm on this map is therefore equal to 1km.
This means that every grid square is 1km x 1km.
With this information you can estimate the area that is covered by types of land on the map.

Relief
Relief is the shape and height of land.
It can be shown in 3 different methods.
The most common methods are:
Contour lines
Spot heights
Layer colouring
Altitude and height are different.
Height: The measurement of how tall something is, usually from its base to its top (e.g. the height of a hill or building).
Altitude: The measurement of how high something is above sea level (e.g. an aircraft flying at 10,000 m altitude or a town at 1,500 m altitude).
In Geography, altitude is more useful because it provides a universal reference point (sea level).


Contour Lines
Brown/orange lines on a map that join points of equal height above sea level.
The closer together the lines, the steeper the slope; the further apart, the gentler the slope.
Spot Heights
A black dot with a number beside it showing the exact height (in metres) of that specific point above sea level.
Layer Colouring
Different shaded colours on a map used to show changes in height.
Low land = green, higher land = yellow/brown, mountains = darker brown.
Cross Sections
What is a Cross Section?
A cross section is a side-view diagram that shows the changes in relief (height/shape of the land) along a straight line drawn between two points on a map.
It helps us visualise the land’s profile (e.g. hills, valleys, coastal cliffs).
How Are Cross Sections Created?
On the map, choose two points (e.g. A to B). Place a straight line between them.
Lay a strip of paper along the line and mark every contour crossing (and any spot heights).
Transfer these marks onto graph paper.
Plot the heights accurately on the vertical axis, keeping scale consistent.
Join the points smoothly to reveal the land’s shape.
Step 3

Step 4
Step 1


Step 2

Step 5

Keys and Symbols
What are Keys and Map Symbols?
Symbols are small drawings or shapes used on maps to represent real-world features (e.g. a tree symbol for woodland, a blue line for a river).
The key (or legend) explains what each symbol means so that the map can be read correctly.
How They’re Used in Exams
Identifying features: e.g. locating a school, river, or road.
Describing areas: e.g. settlement patterns, land use, transport routes.
Supporting other skills: combined with grid references, bearings, distance, or cross-sections.

Do You Need to Memorise Them?
❌ No! In the IGCSE exam, you will always be provided with a key on the map extract.
✔️ Your task is to use the key to interpret what the symbols mean, not to memorise them.

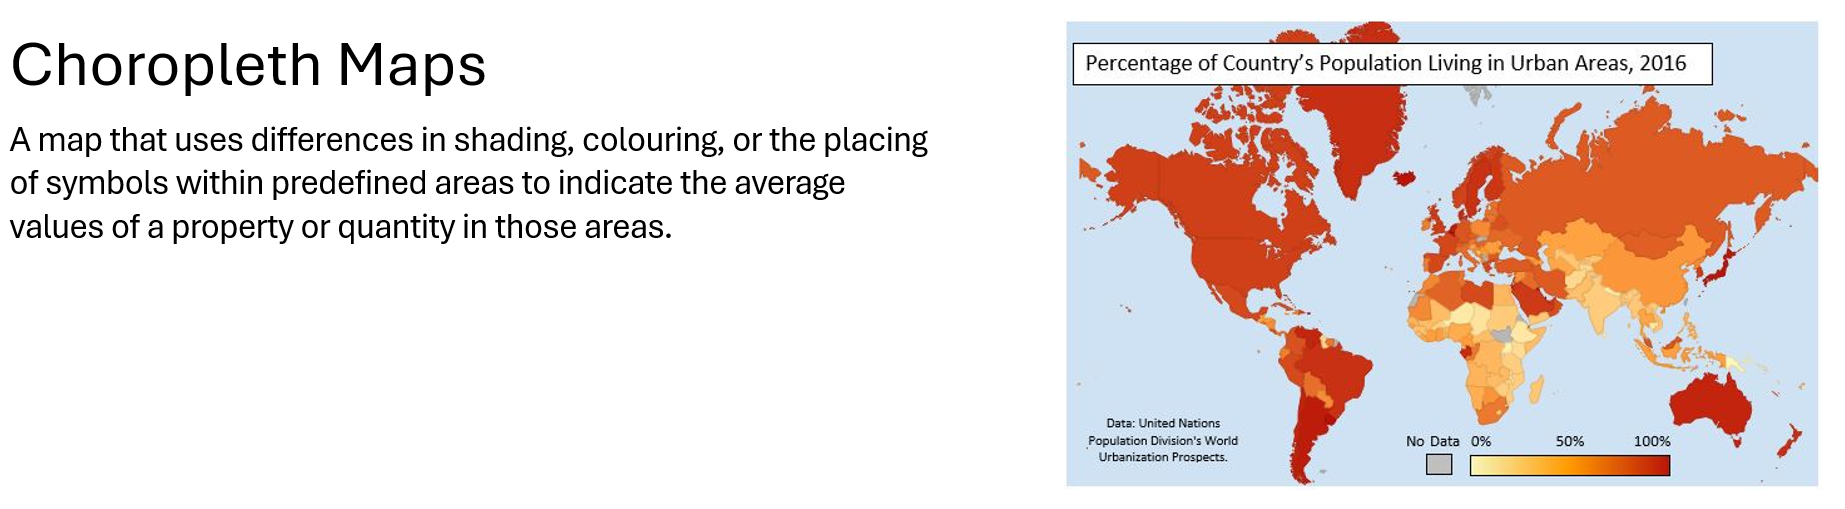
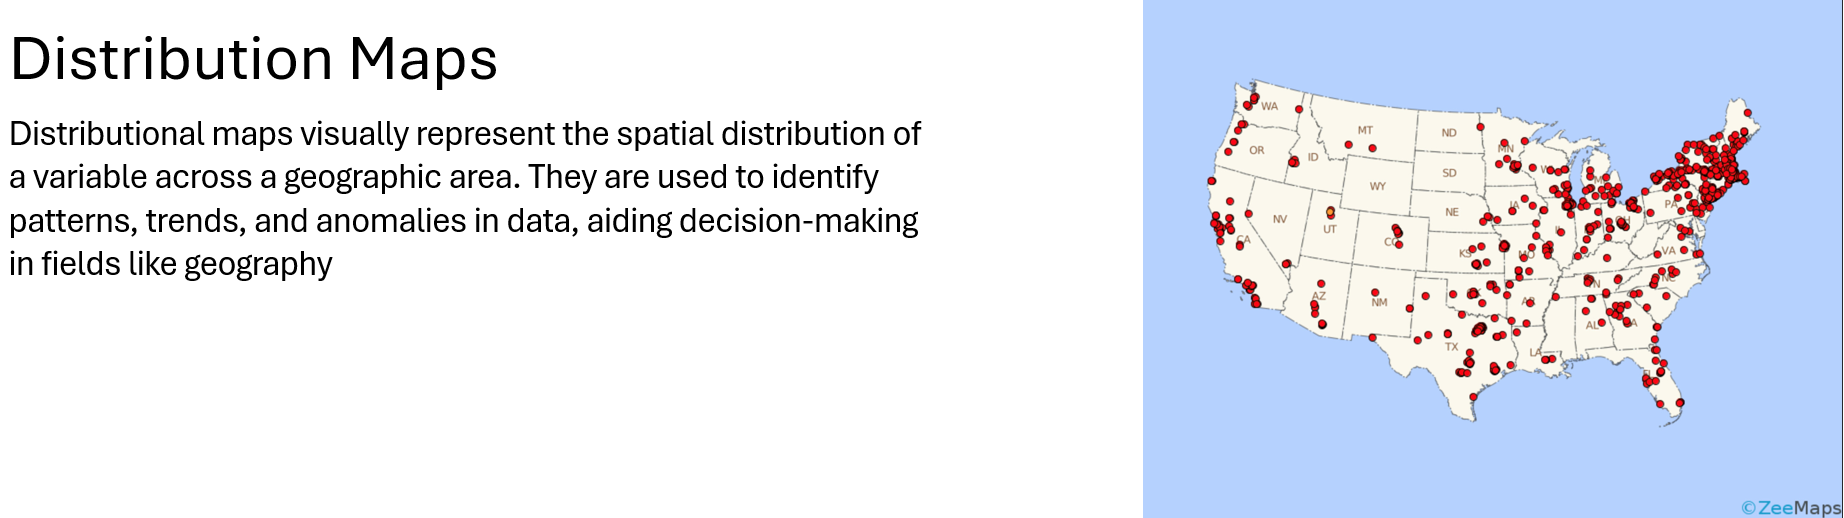
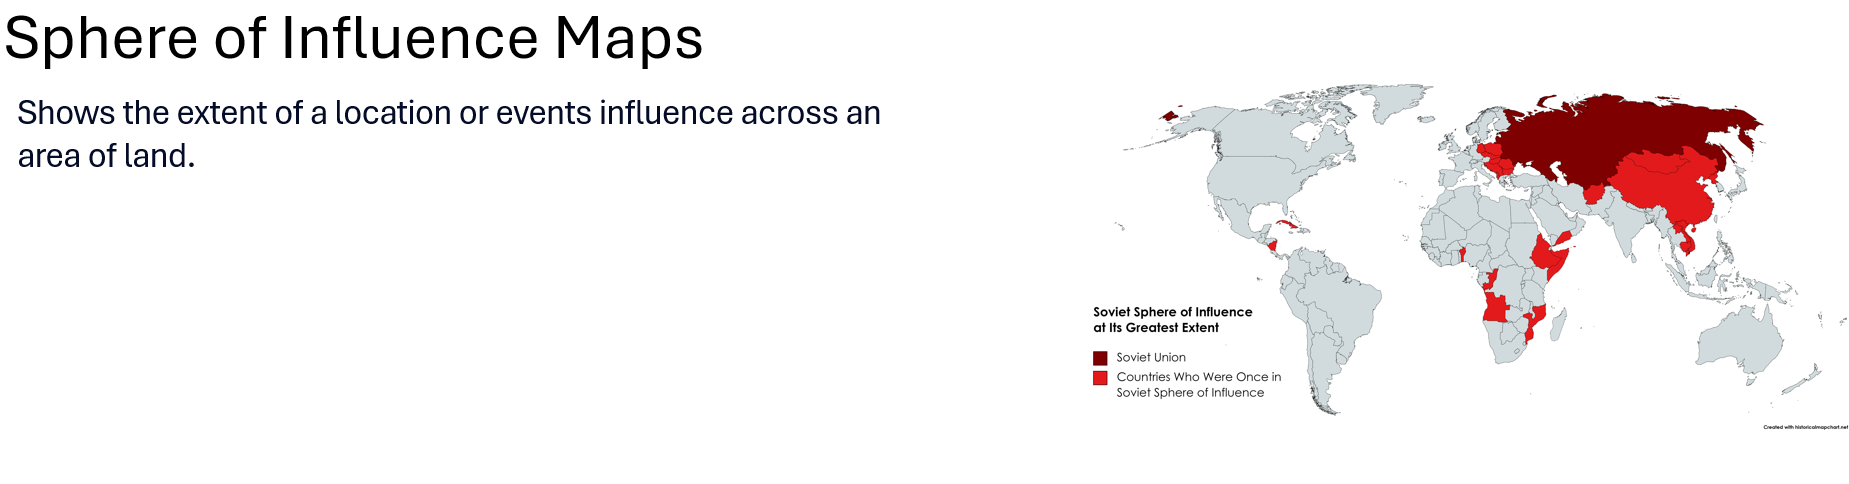
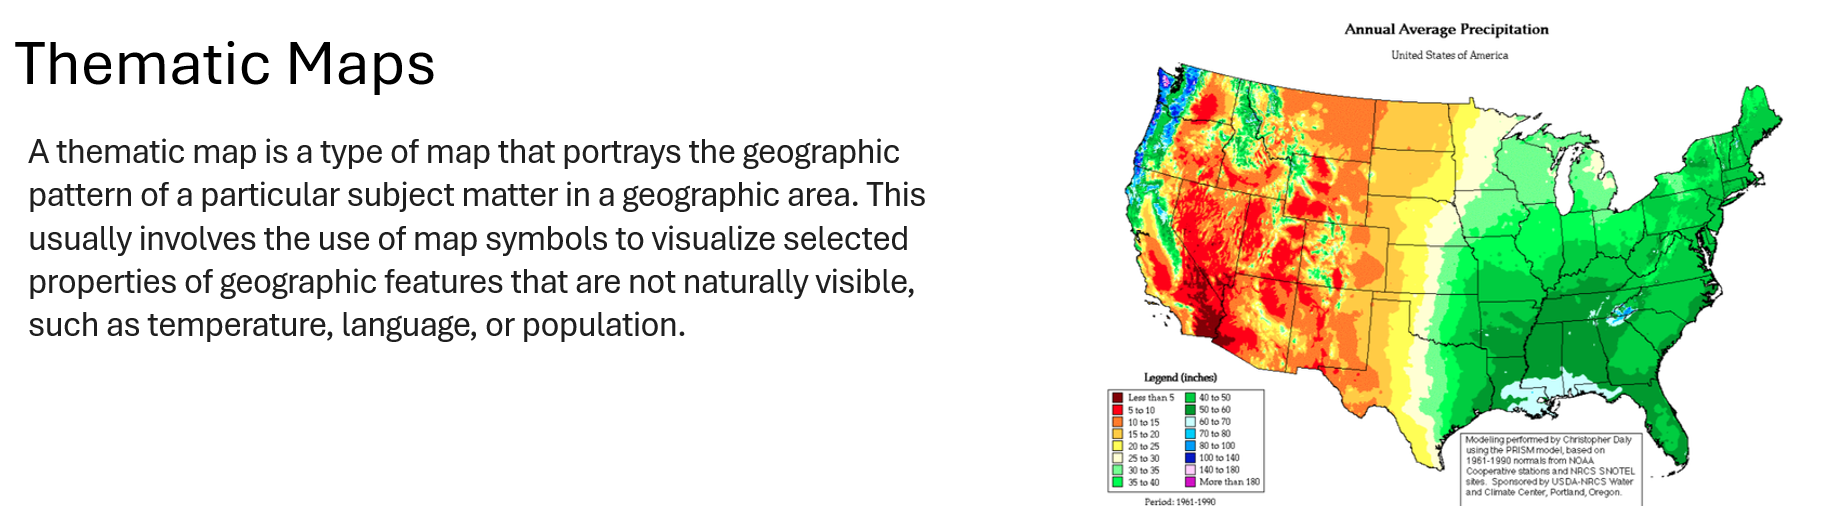
Map Types